How-To
How To Monitor a VCSA Using vimtop
By using vimtop, you can avoid resource shortages and bottlenecks that may cause your vCenter Server Appliance to offer less-than-optimal performance.
The vCenter Server Appliance (VCSA) is now the de facto standard for managing a vSphere environment. In order for your vSphere environment to run efficiently, you'll want to ensure that it has all the resources that it needs. Fortunately, just for that purpose, VMware has included vimtop, a preinstalled tool to monitor all the key resources that a VCSA consumes, which is similar to Linux top or esxtop. By using vimtop, you can avoid resource shortages and bottlenecks that may cause your VCSA to offer less-than-optimal performance.
Accessing vimtop
Vimtop comes preinstalled on all VCSAs but you'll need to enable SSH on the VCSA you want to monitor in order to access it. This is done via the vSphere Web Client.
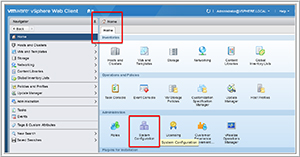
From the Home screen of the vSphere Web Client, select Administration | System Configuration (Figure 1).
 [Click on image for larger view.]
Figure 1. System configuration.
[Click on image for larger view.]
Figure 1. System configuration.
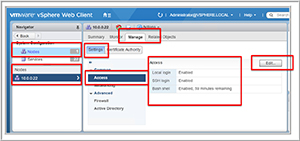
Next, select Nodes | Manage | Settings | Nodes | [select your VCSA] | Access | Edit | Enable SSH (Figure 2).
 [Click on image for larger view.]
Figure 2. Edit access settings.
[Click on image for larger view.]
Figure 2. Edit access settings.
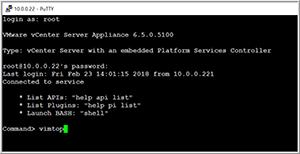
Once you've enabled SSH, you access your VCSA by using an SSH client (such as PuTTY) by entering the IP address of the management network of the VCSA as root (Figure 3).
 [Click on image for larger view.]
Figure 3. Accessing vimtop using PuTTY.
[Click on image for larger view.]
Figure 3. Accessing vimtop using PuTTY.
Overview of vimtop
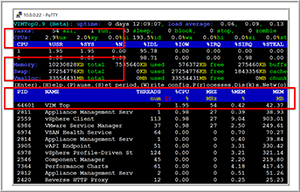
The default vimtop screen provides you with an overview and task pane. The overview pane will quantify the CPU and memory resources that your VCSA is currently consuming; the task pane will show you the processes that are consuming the most CPU resources (Figure 4).
 [Click on image for larger view.]
Figure 4. The vimtop home screen.
[Click on image for larger view.]
Figure 4. The vimtop home screen.
By default, vimtop refreshes its data every second. To pause this automatic refresh, press "p"; alternatively, to set a lower refresh rate, press "s" and then enter the number of seconds between screen refreshes.
To see the help menu, press "h." The help menu will explain how to add, remove and reorder columns from vimtop. To quit vimtop, press "q."
The CPU activity should never total more than 70 percent for your VCSA.
Monitoring Memory Usage with vimtop
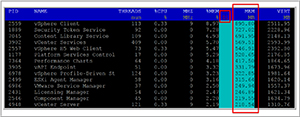
An overview of memory usage is displayed on the default screen of vimtop, in which tasks are sorted by individual metrics. In Figure 4, the metric that tasks are currently sorted by is indicated by Z1, and the individual processes are sorted by the %CPU column. The sort order can be changed, but the process to do so is not very intuitive. For example, to sort the processes that are using the most memory, hit "z" to clear the current sort order, then press the right arrow key until the MEM MB column is highlighted, and then press "d"; this will sort the column in descending order, from the process that's using the most memory at the top to the process that's using the least at the bottom (Figure 5).
 [Click on image for larger view.]
Figure 5. Sort by MEM.
[Click on image for larger view.]
Figure 5. Sort by MEM.
The most useful memory metrics to monitor consumption are %MEM (physical memory usage in percent for this process), MEM (physical memory used by this process) and VIRT (total virtual memory size of this process; this is the complete working set, including resident and swapped memory).
Monitoring Disk Usage with vimtop
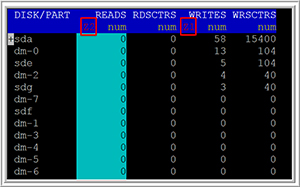
CPU and memory can be monitored from the default screen. To monitor disk usage, however, you'll need to go to the disk view by pressing "k." By default, the task view will be sorted by the DISK/PART (disk and partition). I find it more useful to sort by the number of reads and writes per second issued to a disk and partition. To do this, press "z," the right arrow key until the WRITES column is highlighted, then "d." Next, press the left arrow key until the READS column is highlighted, then "d" to make READS the secondary sort column. At this point, the WRITES column will be tagged with Z1 and the READS will be tagged with Z2. Pressing "p" will pause and un-pause the refreshing of the screen (Figure 6).
 [Click on image for larger view.]
Figure 6. Disk metrics sorted by multiple columns.
[Click on image for larger view.]
Figure 6. Disk metrics sorted by multiple columns.
Disk activity will fluctuate depending on which operations are taking place on your VCSA. For this reason, I find this particular view most useful to trouble shoot intermediate issues with a specific process or to see long-term trends that may dictate moving the VCSA to a higher-speed storage device.
Monitoring Network Usage with vimtop
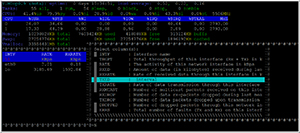
As with disk metrics, a separate view is needed to see network activity. The network view can be accessed by pressing "o." When examining network statistics, I find the most useful metrics to display are RXED and TXED, the total amount of data received and sent. These metrics are not displayed on the default network view.
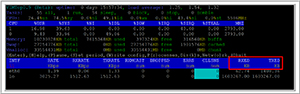
You can add additional metrics columns to a view. To add a new column, use the right and left arrow keys to select the display column where you want the new column to appear, and then press "c" to review the additional metrics that can be displayed. You can then use the up and down arrow keys to highlight the column you want to add; then, press the space bar and the column will instantly be added to your view. Note, if you press the space bar on a column that's already displayed, it will be removed from the view (Figure 7). Press the Esc key to exit the column selection screen (Figure 8).
 [Click on image for larger view.]
Figure 7. Adding columns to a view.
[Click on image for larger view.]
Figure 7. Adding columns to a view.
 [Click on image for larger view.]
Figure 8. Columns added to network view.
[Click on image for larger view.]
Figure 8. Columns added to network view.
Wrapping Up
By using vimtop, you can ensure that your VCSA is running optimally. In this article, I showed you how to access vimtop and use it monitor your VCSA resource usage. I also showed you how to customize the order of the metrics of process, and add additional columns to the views that you're monitoring. As a quick side note, I've noticed that not all of the columns listed were fully supported in the version of vimtop that I was using. Hopefully we'll see this fixed in future releases.
About the Author
Tom Fenton has a wealth of hands-on IT experience gained over the past 30 years in a variety of technologies, with the past 20 years focusing on virtualization and storage. He currently works as a Technical Marketing Manager for ControlUp. He previously worked at VMware in Staff and Senior level positions. He has also worked as a Senior Validation Engineer with The Taneja Group, where he headed the Validation Service Lab and was instrumental in starting up its vSphere Virtual Volumes practice. He's on X @vDoppler.