How-To
How To View vimtop Data in PerfMon
Vimtop is a valuable tool that can be used to ensure that your VMware vCenter Server Appliance (VCSA) remains as performant as possible. When it's coupled with a monitoring tool such as PerfMon, it's easy to spot trends or anomalies that are affecting your VCSA.
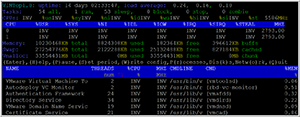
Used to monitor the overall health of and identify the processes that are running on and consuming your VMware vCenter Server Appliance (VCSA) resources, vimtop (as shown in Figure 1), is a real-time monitoring tool for VCSA. In a previous article, I showed you how to view vimtop data on a chart in an Excel spreadsheet, but you can view this same data by using Microsoft's built-in Performance Monitor tool, PerfMon, and in this article I'll show you how.
If you're unfamiliar with vimtop and its capabilities, I would suggest that you start by spending a few minutes reviewing my previous articles, "How To Monitor a VCSA Using vimtop" and "How To Use Advanced Features of vimtop To Monitor VCSA."
 [Click on image for larger view.]
Figure 1. The real-time monitoring tool for VMware vCenter Server Appliance, vimtop.
[Click on image for larger view.]
Figure 1. The real-time monitoring tool for VMware vCenter Server Appliance, vimtop.
Capturing vimtop Data
Let's start off with a quick summary of how to capture vimtop data for historical analysis. The "-b" switch is used to start vimtop in "batch," which streams data to the console rather than displaying it on the console. Here's the command that I use to collect vimtop data every 60 seconds for 15 iterations and then redirect the data to a file called TOPMin.csv (the file should have a .csvextension if it's to be examined using PerfMon):
vimtop -b -c MemConfig -p 60 -n 15 > TOPMin.csv
By default, a lot of data is collected and emitted by vimtop, so I used a configuration file called MemConfig to limit this data flow. I would suggest that you read the articles I mentioned earlier to get a better understanding of how vimtop data can be captured by using the "-b" and "-c" switches.
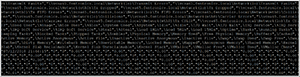
The data output by vimtop consists of multiple lines of data. The first line contains the names of the counters for which the data is being collected, and each subsequent line denotes an iteration of the data collected. All the fields of data are contained in quotes and separated by commas. For example, if you specify "-n 15," you'll have 16 lines of data, the first being the name of counter and the rest being the data (Figure 2).
 [Click on image for larger view.]
Figure 2. The batch data output by vimtop.
[Click on image for larger view.]
Figure 2. The batch data output by vimtop.
Transporting vimtop Data
Although PerfMon can read the output of the captured vimtop data directly so no other data transformation is required, you'll still need to transport the data once it's captured to a Windows system that's running PerfMon. Fortunately, modern versions of Windows desktop and server OSes have PerfMon preinstalled on them.
I found that using secure copy (SCP) to transport the data to a Windows system works well. In order to use SCP to transport data from the VCSA, however, you'll need to enable SSH and the BASH shell (which you should have already been done in order to access your VCSA and to run vimtop). Additionally, you'll need to set BASH as the default shell for your VCSA. To do this, log on to your VCSA as root and run the following command:
chsh -s /bin/bash root
For more information on this configuration, see the VMware Knowledge Base article, "Toggling the vCenter Server Appliance 6.x default shell (2100508)."
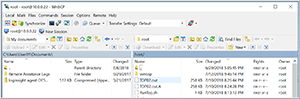
Once you've set your default shell to BASH, you can use a program such as Windows Secure Copy (WinSCP) to connect to your VCSA and copy your vimtop data to your Windows system (Figure 3).
 [Click on image for larger view.]
Figure 3. You can use WinSCP to copy vimtop data from VCSA to your Windows system.
[Click on image for larger view.]
Figure 3. You can use WinSCP to copy vimtop data from VCSA to your Windows system.
Using PerfMon to View vimtop Data
To initiate PerfMon, search for perfmon from the Start Menu on your Windows system. I use a Windows 10 system, but other Windows OSes will follow a similar workflow.
Once PerfMon has started up, click on the Performance Monitor icon (Figure 4). Right away, this will display the current performance of the local Windows system.
 [Click on image for larger view.]
Figure 4. Clicking on the Performance Monitor icon will the current performance of your Windows sytem.
[Click on image for larger view.]
Figure 4. Clicking on the Performance Monitor icon will the current performance of your Windows sytem.
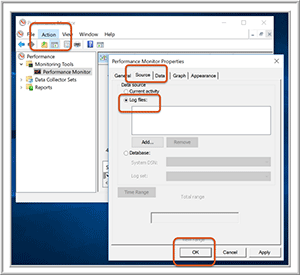
To display the vimtop output, click the Action tab, select Properties from the Performance Monitor Properties dialog, select Source, select Log files, select Add, then locate the file that contains your vimtop data (Figure 5).
 [Click on image for larger view.]
Figure 5. Adding vimtop data to Performance Monitor.
[Click on image for larger view.]
Figure 5. Adding vimtop data to Performance Monitor.
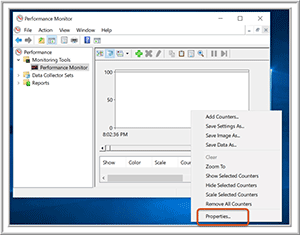
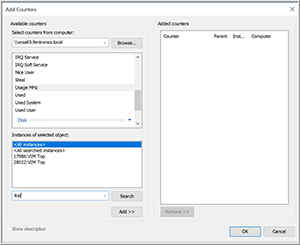
After you import the data into PerfMon, you'll be presented with a blank graph. To add counters to PerfMon, right-click in the graph area and select Properties (Figure 6), and then click Add; this will bring up a list of values that were captured (Figure 7).
 [Click on image for larger view.]
Figure 6. PerfMon without counters.
[Click on image for larger view.]
Figure 6. PerfMon without counters.
 [Click on image for larger view.]
Figure 7. Vimtop with counters.
[Click on image for larger view.]
Figure 7. Vimtop with counters.
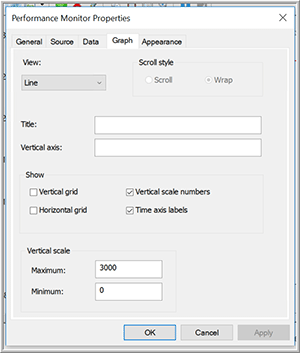
Once the counters have been selected, click Add and then click OK. By default, it will display the data on a scale from 0 to 100. To change the scale, right-click in the graph area and select Properties, and then click Graph (Figure 8). If you select a counter that shows a percentage of resources being consumed, change the scale from 0 to 100 to 0 to 1. You can also change and customize other properties of the graph from this window, if you wish, such as the names of the axes.
 [Click on image for larger view.]
Figure 8. Changing the Vertical scale.
[Click on image for larger view.]
Figure 8. Changing the Vertical scale.
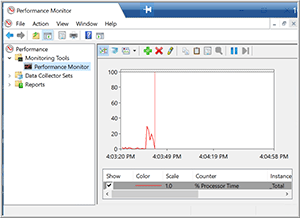
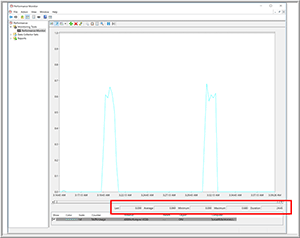
Not only does PerfMon graph the data, it also displays the average, minimum, and maximum values and the duration of the information that you're viewing (Figure 9); this is one of the features I really like about PerfMon.
 [Click on image for larger view.]
Figure 9. PerfMon graph of vimtop data.
[Click on image for larger view.]
Figure 9. PerfMon graph of vimtop data.
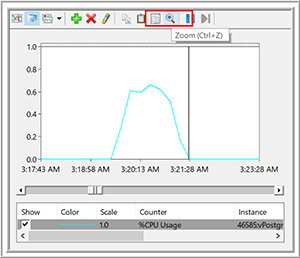
Another feature I find very helpful is the ability to select a specific region of the graph and then use the magnifying glass to zoom in to that segment of the graph (Figure 10).
 [Click on image for larger view.]
Figure 10. Zooming in on a specific segment of the graph.
[Click on image for larger view.]
Figure 10. Zooming in on a specific segment of the graph.
Wrapping Up
Vimtop is a valuable tool that can be used to ensure that your VCSA remains as performant as possible. When it's coupled with a monitoring tool such as PerfMon, it's easy to spot trends or anomalies that are affecting your VCSA, as well as in order to proactively address them and to ensure that your VCSA continues to perform at maximum efficiency.
About the Author
Tom Fenton has a wealth of hands-on IT experience gained over the past 30 years in a variety of technologies, with the past 20 years focusing on virtualization and storage. He currently works as a Technical Marketing Manager for ControlUp. He previously worked at VMware in Staff and Senior level positions. He has also worked as a Senior Validation Engineer with The Taneja Group, where he headed the Validation Service Lab and was instrumental in starting up its vSphere Virtual Volumes practice. He's on X @vDoppler.