Hyper-V on Hyper-Drive, Part 4: Monitoring Hyper-V The Right Way
It's time to put what you've learned into practice and then make sure that Hyper-V is running at hyperspeed.
Read the complete series:
Now that we have the basics of Microsoft Hyper-V down, let's look at how to monitor performance of VMs and how your skills in this area translate from the physical to the virtual world. There's sometimes a sense among IT pros (or their bosses) that performance monitoring isn't necessary any longer -- "just beef up the VM with more resources" -- but I think it's vital to understand what's going on under the covers because that's essential knowledge when things go wrong. It also pays to be able to determine which resource (Processor, Disk, Network, Memory) is under pressure.
Task Manager Inside a VM Is a Liar
First of all, don't ever rely on Task Manager (or even Sysinternal's Process Monitor) inside of a VM to inspect performance. A VM only sees its own view of the world with regards to memory and processor usage and it's a very false view indeed. To give you an example, imagine a single VM with four VPs on a host with a quad-core CPU with an application running that consumes all available CPU resources. This VM will get most of the processor performance of the host (with a little reserved for the parent partition). Task Manager in the VM will report 100-percent CPU usage across its four virtual cores.
If you now start another VM and run the same application inside it, it will also report 100-percent CPU across its processors, but each of those applications will actually be working at half the speed compared to a single VM running. The same goes for memory monitoring -- with dynamic memory in play, Task Manager can't give an accurate portrayal of memory usage.
Baselines, Baselines, Baselines!
The second step to take for all performance monitoring, in both the virtual and the physical world, is to establish baselines when everything is hunky-dory. If you have measurements of the main components of a VM at a time when users are happy, it's much easier to spot the problem area when users or your monitoring software flags a problem, by simple comparison.
Your friend here is Performance Monitor, which is present on every Windows system. Learn how to use Data Collector Sets to log counters over time.
Hyper-V Counters Are Your Friends
Even Task Manager and Performance Monitor in the host can be confused and lie about virtualization performance if you use the normal counters. Fortunately there are Hyper-V specific counters that don't lie (see Fig. 1); for processors use the Hyper-V Hypervisor Logical Processor\% Total Run Time counter. This monitors the load on your physical cores in your processors. To look in on CPU performance inside a VM use Hyper-V Hypervisor Virtual Processor\% Guest Run Time; this lets you monitor VPs for each VM or a total of all running VMs. For the latter, a rule of thumb is that less than 75 percent across all VMs is a healthy load on the host overall, over 75 percent is a warning and more than 85 percent needs to be looked into.
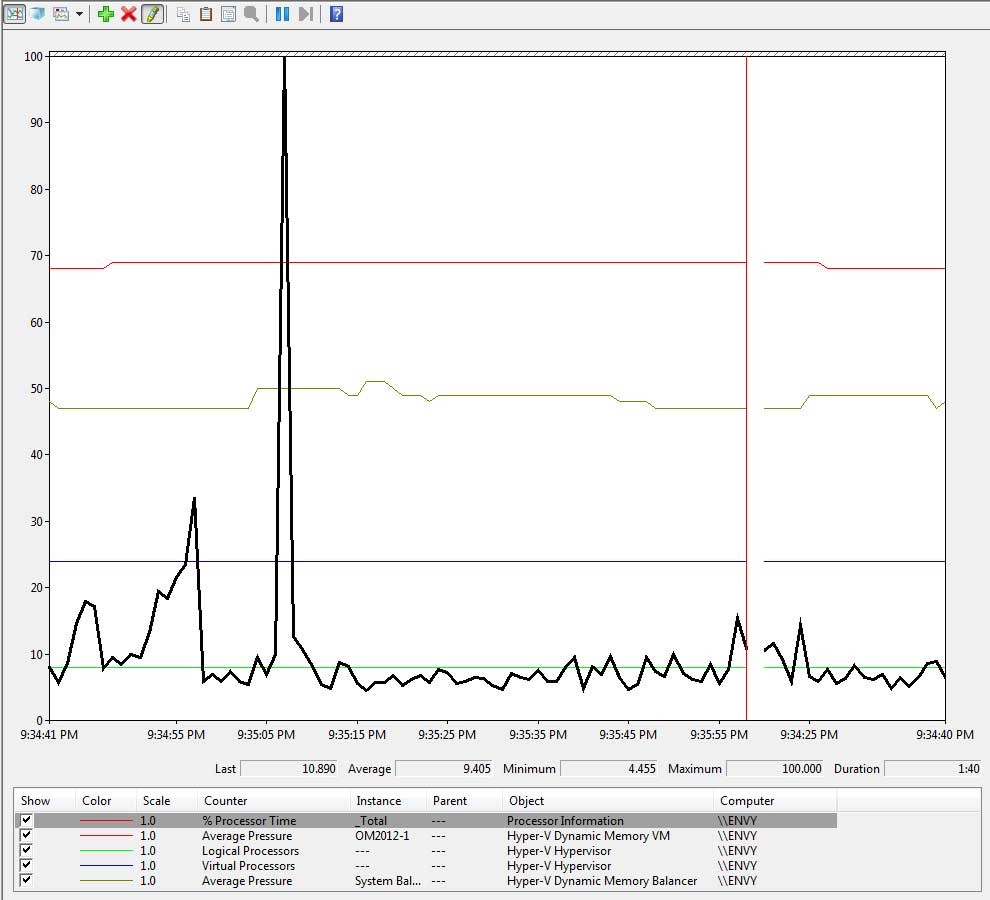 |
Figure 1. Really spend some time with Performance Monitor, getting to know the different objects and counters and how your fabric and VMs are actually performing. (Click image to view larger version.) |
Committed Memory
While dynamic memory makes memory management a bit fluid, do keep an eye on \Memory\Available Mbytes for the host. As long as there's 10 percent free you should be right, but when it goes under 10 percent free it's a warning. At less than 100 MB it's definitely time to investigate.
Dynamic memory also brings a new set of counters. The most important is the \Hyper-V Dynamic Memory Balancer\Average Pressure counter, where healthy is less than 80. A value between 80 and 100 deserves attention, while over 100 indicates a critical condition.
Having a Bit (of Bemory) Up Your Sleeve
Dynamic memory lets you set an initial value (the VM will never have less than this amount of memory) and you can let it scale to use whatever memory it needs. Even then, you always want to have a bit of an extra buffer. That's what the Memory Buffer setting for dynamic memory is about, with the default at 20 percent. If you have workloads to utilize a lot of file cache (file servers), it can help performance if you increase the buffer size (see Fig. 2).
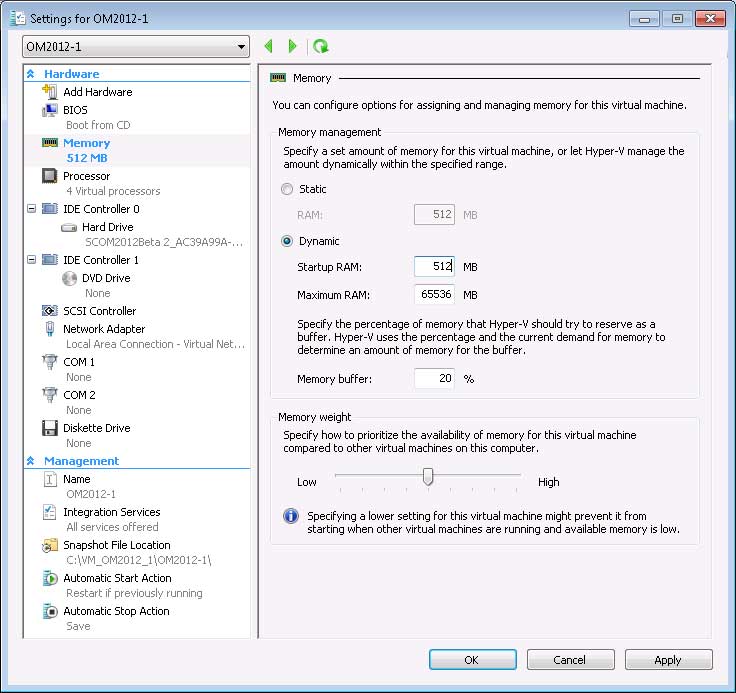 |
Figure 2. Set your buffer based on the file cache you expect the server to use. (Click image to view larger version.) |
Disk Latency
Keep an eye on your disks with the \LogicalDisk(*)\Average Disk Sec\Read or Write counters which indicate disk latency. A good rule of thumb is that OK is less than 10ms (0.010); 15ms or above (0.015) is a warning; at 25ms or above (0.025) the situation is critical.
Network monitoring
To monitor network usage the counter, \Network Interface (*)\OutputQueue Length is your friend. Less than 1 on average is healthy, warning is when it's above 1 on average, critical is when it's 2 or more on average.
| Hyper-V Performance Tuning Resources |
Download a performance tuning whitepaper for both the physical and virtual world from Microsoft for Windows Server 2008 R2 here.
For a variety of information on performance tasks, look here.
The Performance Analysis of Logs (PAL) is a PowerShell script that can help you out in deciding which performance counters to collect and how to analyze them.
For disk performance tasks, have a look at Iometer.
Detailed technical information on how to measure performance in Hyper-V can be found here. |
|
|
Conclusion
We've covered hardware considerations for Hyper-V, performance optimizations, tips and gotchas to avoid for performance and how to monitor the performance of your VMs. The key now is to inspect your current environment and implement the hints and tips in this series that make sense in your environment and measure performance before and after each step. Good luck with squeezing hyperspeed out of your Hyper-V environment.
About the Author
Paul Schnackenburg has been working in IT for nearly 30 years and has been teaching for over 20 years. He runs Expert IT Solutions, an IT consultancy in Australia. Paul focuses on cloud technologies such as Azure and Microsoft 365 and how to secure IT, whether in the cloud or on-premises. He's a frequent speaker at conferences and writes for several sites, including virtualizationreview.com. Find him at @paulschnack on Twitter or on his blog at TellITasITis.com.au.