How-To
Quick and Easy vCenter Metrics With ESXtopNGC Plugin
A guide to installing and using this indispensable -- and free -- tool.
VMware Labs recently released a new Fling called "ESXtopNGC Plugin." As the name implies, this Fling is a plugin for vCenter that displays esxtop metrics. A "Fling" is a program put together by VMware Engineering for the benefit of VMware customers; they're not official VMware products, and aren't supported by VMware. Flings do occasionally end up as VMware products, however.
Esxtop is the de facto go-to tool for monitoring and collecting system resource data from an ESX system; it's a command-line tool, and to use it you need to SSH into your host ESX. If you ever wish to become an ESX expert, more than likely you'll need to use esxtop.
With this Fling, no longer do I need to log in to each one of my ESX servers and run esxtop to take a look at the health of my systems. Instead, I can access esxtop statistics from the comfort of my vCenter Web client. I do still use the host-based version of esxtop to do deep dives and gather statistics for later analysis, but for a quick peek at metrics, this plugin is the way to go.
Painless Installation
Installation of the product was surprisingly easy. I was able to have it up and accessible in less than five minutes. To install the ESXtopNGC plugin, I downloaded it (see link below) to my laptop and then used my go-to SCP program,
PuTTY, to transfer it to my vCenter server appliance (VCSA) in the root directory:
pscp ESXtopNGCPlugin-01.zip [email protected]:/
Next, I SSHed into my VCSA as root, changed to my root directory and extracted the program, using unzip:
unzip ESXtopNGCPlugin-01.zip -d /usr/lib/vmware-vsphere-client/plugin-packages/esxtop-plugin
Note: I downloaded ESXtopNGCPlugin-01.zip. Your version may have a slightly different name; if so, your unzip command should reflect this.
I then restarted the vSphere client:
/etc/init.d/vsphere-client restart
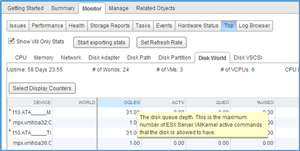
After re-logging into my vSphere Web client, I selected a host, went to the "Monitor" tab and selected the "Top" tab, which provided the esxtop statistics for that server (see Figure 1).
 [Click on image for larger view.]
Figure 1. Statics from the VMware "Fling" ESXtopNGC.
Easy to Use
The interface is very user-friendly and intuitive. Select the tab of the resource (CPU, Memory, Network and so on) for which you would like to see the metrics, and they'll be displayed. If you forget exactly what a metric measures (I always forget the difference between %OVRLP and %CSTP), simply hover over it with your mouse; a popup will display a quick summary.
If you need to sort on a specific metric, simply click on it. If you need to see a metric that isn't currently being displayed, you can click "Select Display Counters" and select or deselect the metrics you want to display. If the metrics aren't being updated quickly enough, select "Set Refresh Rate" and choose a refresh rate more in line with what you need. If you need to export the metrics, you can select "Start Exporting Stats," and they'll be saved to your vCenter server in .csv format.
I did see a few minor issues with esxtop: not all statistics have a popup associated with them when you hover over them; the refresh rate was a little uneven; and shockwave flash crashed on me a couple of times, although I was able to recover without any issues.
We Have a Winner
VMware Labs has a winner with this plugin: it's easy to install, intuitive to use, very powerful -- and free. Very seldom do you get a product that has all four of these attributes, but this one does. If you're new to esxtop, this is an easy way to start to work with it. New users will find the ability to hover over a metric and get a quick synopsis extremely useful. If you're an old hand with esxtop, this is a great tool for your quiver, since you'll no longer have to SSH into your servers to get a quick look at your metrics.
(VMware Labs states that the plugin is for the VCSA, but it looks like people have gotten it to work with the Windows-installable version of vCenter.)
About the Author
Tom Fenton has a wealth of hands-on IT experience gained over the past 30 years in a variety of technologies, with the past 20 years focusing on virtualization and storage. He currently works as a Technical Marketing Manager for ControlUp. He previously worked at VMware in Staff and Senior level positions. He has also worked as a Senior Validation Engineer with The Taneja Group, where he headed the Validation Service Lab and was instrumental in starting up its vSphere Virtual Volumes practice. He's on X @vDoppler.