How-To
Assess Your vSphere Environment with RVTools
A free app that should definitely be in your systems administrator toolbox.
The VMware vSphere ecosystem has spawned a lot of interesting tools, some being very expensive, and others being free. In this article I look at how to access and use one of the free -- and more powerful and easy-to-use -- tools offered for vSphere: RVTools. Released 11 years ago in 2008 and being one of the oldest vSphere tools, RVTools collects and displays information about your vSphere environment. Over the years, RVTools has gone through many updates but now runs on Windows systems using the .NET 4.6.1 Framework and now supports virtually all versions of ESXi and vCenter Server releases.
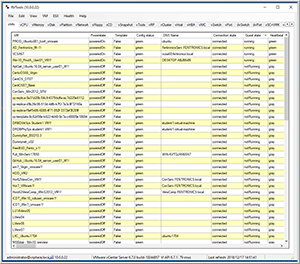
The main function of RVTools is reporting on the configuration of vCenter Servers, ESXi servers, and the virtual machines (VMs) that reside on a vSphere environment, including cluster configuration, networking, storage, and snapshots. Its reporting output display is a spreadsheet-style GUI with tabs to its various sections (Figure 1), with the capability to export the information as an Excel or .csv file.
 [Click on image for larger view.]
Figure 1. The RVTools output.
[Click on image for larger view.]
Figure 1. The RVTools output.
Installing and Setting Up RVTools
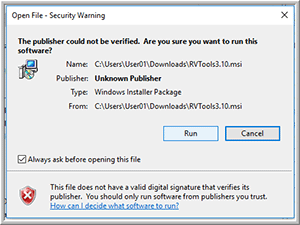
RVTools doesn't care what version of Windows it's running on as long as it has .NET 4.6.1 installed on it. Once you've verified that you have .NET 4.6.1 on your system, you can download the RVTools MSI package from robware.net/rvtools and then double-click the MSI package to install it (Figure 2).
 [Click on image for larger view.]
Figure 2. The RVTools installation.
[Click on image for larger view.]
Figure 2. The RVTools installation.
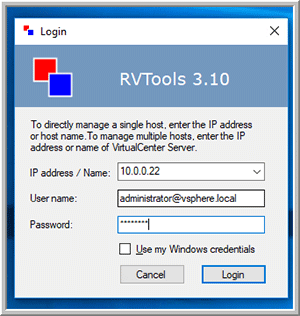
Once RVTools has been installed, you can run it by entering RVTools at the Start prompt. This will bring up the RVTools log-in interface (Figure 3), where you can enter the IP address or DNS and credentials of a vCenter Server or ESXi host.
 [Click on image for larger view.]
Figure 3. The RVTools log-in window.
[Click on image for larger view.]
Figure 3. The RVTools log-in window.
RVTools Usage
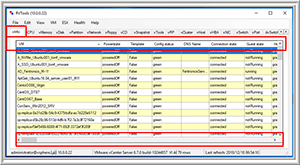
Once initiated, the first screen that RVTools displays is vInfo (Figure 4), a screen that contains information regarding the VMs that reside in your vSphere environment. The information obtained from the VM is very comprehensive, ranging from the power state of the VM to the information of the fault tolerance's configuration of the VM.
 [Click on image for larger view.]
Figure 4. The vInfo screen.
[Click on image for larger view.]
Figure 4. The vInfo screen.
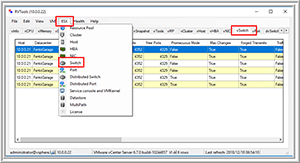
The dropdown menus at the top of the interface are the way in which RVTools organizes the quick links to the various columns. For example, if you select the Switch field from the ESX dropdown menu, it will bring you to the vSwitch tab (Figure 5).
 [Click on image for larger view.]
Figure 5. The vSwitch tab.
[Click on image for larger view.]
Figure 5. The vSwitch tab.
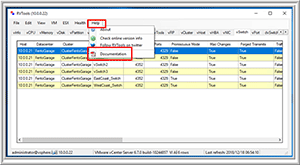
RVTools gathers a lot of information; fortunately, by selecting Documentation from the Help dropdown menu (Figure 6), you can review the 118-page documentation, which does a good job of explaining what each of the fields in RVTools means.
 [Click on image for larger view.]
Figure 6. Accessing the Documentation from the Help menu.
[Click on image for larger view.]
Figure 6. Accessing the Documentation from the Help menu.
You can use RVTools with various switches from the command line to automate data collection. For example, you can start RVTools with pass-through authentication, and export it a to an .xlsx file. The documentation gives lots of examples of command lines to extract information about your environment.
Health Check
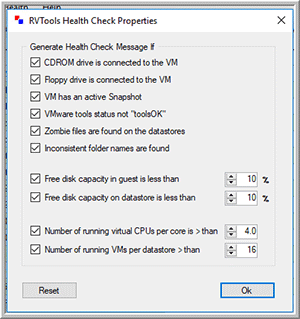
RVTools is more than a reporting tool; it also has a vHealth tab that highlights issues that may cause you problems in your vSphere environment (Figure 7).
 [Click on image for larger view.]
Figure 7. The RVTools Health Check Properties window.
[Click on image for larger view.]
Figure 7. The RVTools Health Check Properties window.
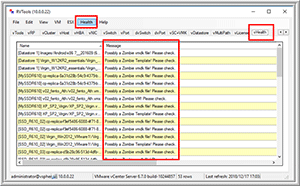
For instance, by looking at the information on my system, I saw that I had many zombie VMs and vmdk files in my environment (Figure 8). This is helpful as deleting them will free up datastore space on my system.
 [Click on image for larger view.]
Figure 8. Health Check messages show you what's running on your system so you can free up datastore space.
[Click on image for larger view.]
Figure 8. Health Check messages show you what's running on your system so you can free up datastore space.
Wrapping Up
It's no wonder that RVTools has been around for a decade -- it's powerful, easy to install and free. Overall, RVTools provides you with great insight to your vSphere environment and is a tool that should be in your systems administrator toolbox.
About the Author
Tom Fenton has a wealth of hands-on IT experience gained over the past 30 years in a variety of technologies, with the past 20 years focusing on virtualization and storage. He currently works as a Technical Marketing Manager for ControlUp. He previously worked at VMware in Staff and Senior level positions. He has also worked as a Senior Validation Engineer with The Taneja Group, where he headed the Validation Service Lab and was instrumental in starting up its vSphere Virtual Volumes practice. He's on X @vDoppler.