How-To
MicroK8s, Part 2: How To Monitor and Manage Kubernetes
Tom Fenton shows you how to use both the command line and a GUI to monitor K8s.
This is the second article in a series on Kubernetes (K8s). In my previous article, I showed you how fast and easy it is to install K8s by using Ubuntu as a base system with the MicroK8s snap -- it took me less than 10 minutes. In this article, I go a step further and show you how I monitored and managed K8s by using a GUI.
Managing K8s
Kubectl is a command-line interface for managing a K8s environment. The syntax for the kubectl command is kubectl [command] [TYPE] [NAME] [flags]. To use this command in a MicroK8s environment, you need to prepend the command with microk8s. By using kubectl, you can create and delete resources, autoscale a set of Pods and see the logs.
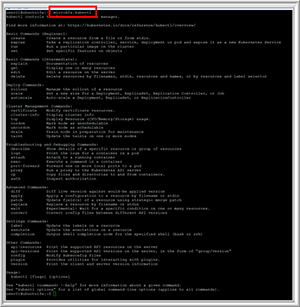
If you enter microk8s.kubectl, it will show what parameters can be used with it (Figure 1). For a full explanation of the parameters, check out the "Overview of kubectl" reference page.
 [Click on image for larger view.]
Figure 1. The microk8s.kubectl parameters.
[Click on image for larger view.]
Figure 1. The microk8s.kubectl parameters.
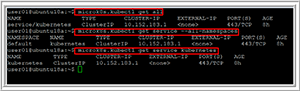
You can verify that services are up and running by entering microk8s.kubectl get along with the type, names and other flags. Figure 2 shows the output of using kubectl with various parameters.
 [Click on image for larger view.]
Figure 2. The microk8s.kubectl commands.
[Click on image for larger view.]
Figure 2. The microk8s.kubectl commands.
Installing Dashboard
Users of K8s have historically used the command line to monitor and manage their environments, which made sense; K8s is all about automation, and scripts are used for much of this automation. However, we've recently seen a plethora of GUIs emerging to manage and monitor K8s environments. The GUI that comes with MicroK8s is Dashboard, which is very easy to install, but does have a few gotchas of which you need to be aware.
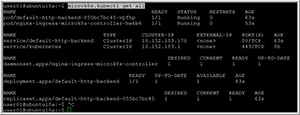
To enable the dashboard and the DNS service, enter microk8s.enable dns dashboard ingress. After doing this, you can enter microk8s.kubectl get all to see that various services have been started (Figure 3).
 [Click on image for larger view.]
Figure 3. The microk8s.kubectl get all services.
[Click on image for larger view.]
Figure 3. The microk8s.kubectl get all services.
Moreover, if you enter ifconfig, you'll see that a lot of interfaces have been added to your system. As the K8s environment has a unique IP addressing scheme, you'll need to set up a proxy to pass requests to access the Dashboard, which you can do by entering microk8s.kubectl proxy --accept-hosts=.* --address=0.0.0.0 &. Note that the & at the end of this command string will run the command in the background.
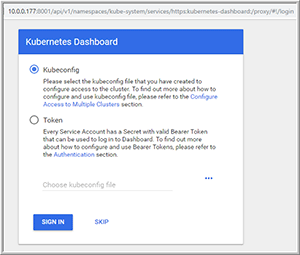
You can then enter the following in a Web browser to access the Dashboard (Figure 4):
http://{Ubuntu_IP_address}:8001/api/v1/namespaces/kube-system/services/https:kubernetes-dashboard:/proxy/
 [Click on image for larger view.]
Figure 4. Gaining access to the Kubernetes Dashboard.
[Click on image for larger view.]
Figure 4. Gaining access to the Kubernetes Dashboard.
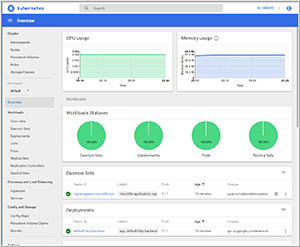
I selected SKIP and was presented with a GUI for my K8s environment (Figure 5).
 [Click on image for larger view.]
Figure 5. The MicroK8s GUI environment.
[Click on image for larger view.]
Figure 5. The MicroK8s GUI environment.
Pods
The basic building block in K8s is the Pod, which encapsulates one or more containers. Each Pod contains resources, such as storage and a unique network IP, and has options that govern how the container should run in the K8s environment. The container needs a runtime engine; Docker is the most common container runtime used in a Pod, but Pods can use other container runtime engines, such as CoreOS rkt, if desired.
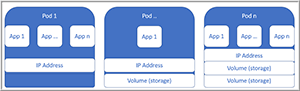
Although single-container Pods are the most popular, a Pod might also encapsulate an application composed of multiple tightly coupled containers that need to form a single cohesive unit of service; for example, one container in the Pod might be serving files from a shared volume to the public, while another or sidecar container in the same Pod might refresh or update those files. By using Pods that have multiple containers and storage resources, you can deploy and manage them as a single entity. Figure 6 shows examples of how Pods can be composed of one or more applications and/or shared resources.
 [Click on image for larger view.]
Figure 6. Different Pod configurations.
[Click on image for larger view.]
Figure 6. Different Pod configurations.
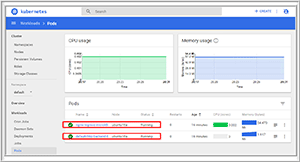
From the Dashboard, I could verify two different Pods now running in my environment (Figure 7).
 [Click on image for larger view.]
Figure 7. Viewing Pod information from the Dashboard.
[Click on image for larger view.]
Figure 7. Viewing Pod information from the Dashboard.
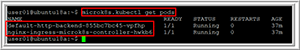
You can obtain this same Pod information from the command line by entering microk8s.kubectl get pods (Figure 8).
 [Click on image for larger view.]
Figure 8. Obtaining Pod information from the command line.
[Click on image for larger view.]
Figure 8. Obtaining Pod information from the command line.
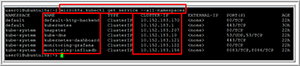
To see all of the containers in my environment, I entered microk8s.kubectl get service --all-namespaces (Figure 9).
 [Click on image for larger view.]
Figure 9. Viewing all container information from the command line.
[Click on image for larger view.]
Figure 9. Viewing all container information from the command line.
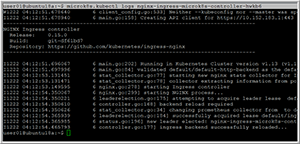
You can use the command line to get the same information as the Dashboard. For example, you can see Pod logs by entering microk8s.kubectl logs nginx-ingress-microk8s-controller-hwkb6 (Figure 10).
 [Click on image for larger view.]
Figure 10. Viewing Pod logs from the command line.
[Click on image for larger view.]
Figure 10. Viewing Pod logs from the command line.
Wrapping Up
In this second article in a series on K8s, I showed you how to monitor and manage your K8s by using the command line and a GUI using MicroK8s. In the next article, I'll show you how I deployed multiple Pods.
About the Author
Tom Fenton has a wealth of hands-on IT experience gained over the past 30 years in a variety of technologies, with the past 20 years focusing on virtualization and storage. He currently works as a Technical Marketing Manager for ControlUp. He previously worked at VMware in Staff and Senior level positions. He has also worked as a Senior Validation Engineer with The Taneja Group, where he headed the Validation Service Lab and was instrumental in starting up its vSphere Virtual Volumes practice. He's on X @vDoppler.