Logs are Easy To Find in the vSphere Web Client: True or False?
I'm not sure about you, but anytime a new interface comes into play I'm fine for the day to day stuff. It's the tough stuff, like troubleshooting that I'm really weary on switching the "how" I do things. With the vSphere Web Client that came in vSphere 5.1, I'm making a deliberate (and occasionally painful) effort to do things that I find easy in the vSphere Client as a learning opportunity in the vSphere Web Client.
One of those things is gathering logs or diagnostic bundles. It's quite easy in the Windows Client, but are the same tasks easy in the Web Client? The fact is, I was actually surprised how easy they are indeed to view in the vSphere Web Client. The first thing to do is find out where to gather logs in the vSphere Web Client. Easy as it is, it's on the Home tree. You then select an object and refresh the contents (see Fig. 1).
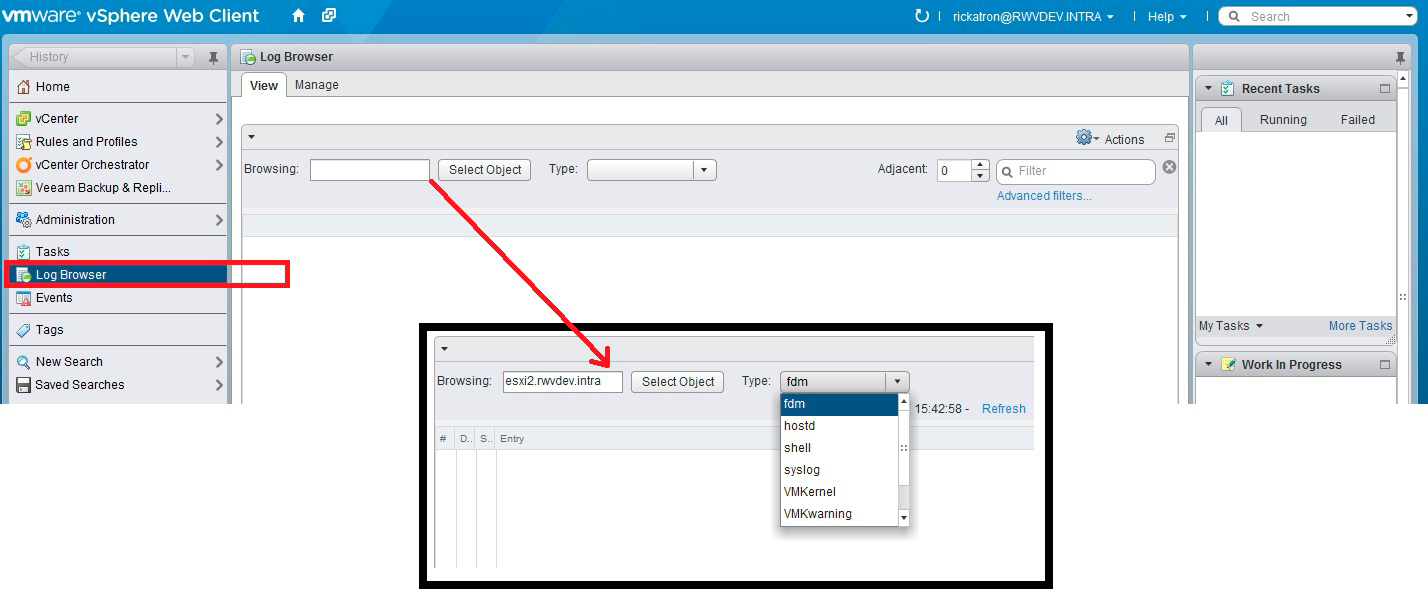 |
Figure 1. Gathering the logs from the Web Client is easy to find on the Home tree. (Click image to view larger version.) |
The collection then queries the host (or vCenter should you select it) to gather the latest logs. Then, you can interactively view these logs and put in filters to make the view easier to display. These bundles gather a lot of data, as you may have known if you've ever collected them before. One situation I have is that I could not have an ESXi host see a storage target on an iSCSI network. Before I jumped into the storage controller or the Windows vSphere Client, I started with the Web Client. iSCSI traffic will be categorized as VMKernel in the Web Client log entry type. The beauty here is that there is a filter that you can put in to the Web Client. I simply put in the IP address of the iSCSI target and can clearly see the error, that the connection failed (see Fig. 2).
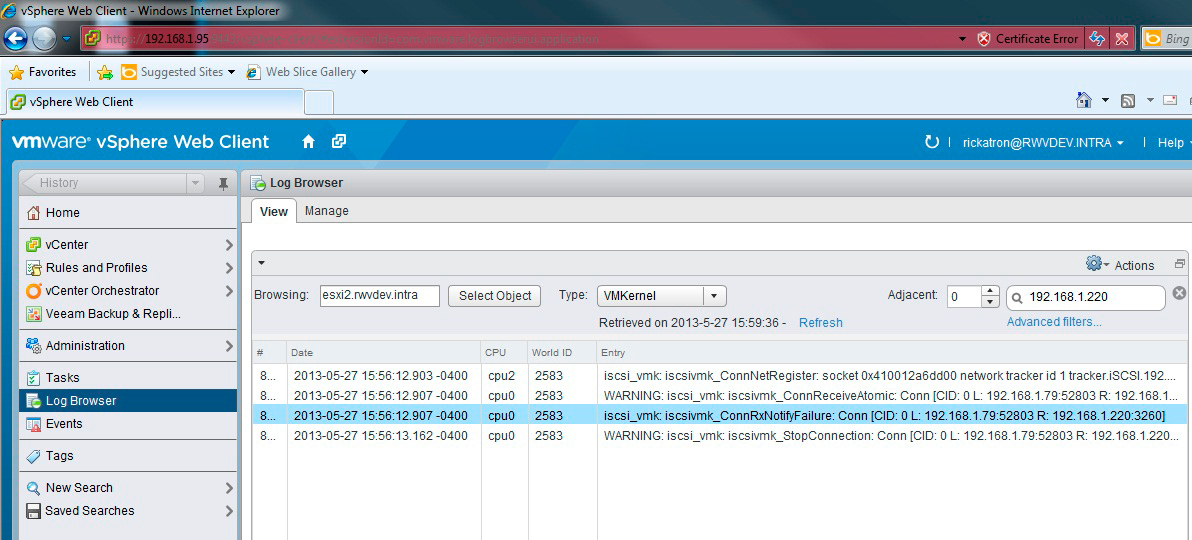 |
Figure 2. The filtering allowed me to see that the connection was refused. (Click image to view larger version.) |
The filtering mechanism is great for point searches, but you can also save filters and make pre-defined searches, especially when multiple criteria are in play. You can load save, and recall AND, NOT and multiple value criteria for other searches in the Web Client.
I'll be the first to admit that I've never been much of a troubleshooter, but this interface allows me to still export the logs (an option on the Gear icon). More important, I just get what I need where I need it. This allows me to interpret the logs quickly, and go and resolve the issue. From looking at this log, it was easy to identify the issue (there is iSCSI TCP port reassignment away from the default 3260). After that was corrected, the issue clearly was resolved.
My first troubleshooting endeavor with the vSphere Web Client was a success! Have you tried troubleshooting here? If so, how was your experience? Share your comments here.
Posted by Rick Vanover on 06/12/2013 at 3:30 PM