2 Handy XenServer Command-Line Utilities
Many of you posted good comments on the XenServer blog I wrote a few weeks ago and so many others e-mailed me about XenServer that I have decided to follow it up with another article. I almost think it is a good idea to post side by side typical commands that are used in VMware vSphere and how they translate in XenServer and Hyper-V.
Maybe I will start a series on VMware admin's guide to XenServer and Hyper-V.
Today, however, I want to introduce you to handy command-line tools: xentop and xsconsole.
For those of you that have been ESX admins for a while now, I am sure you will agree that one of the most important tools in ESX and ESXi for that matter was and still is ESXTOP. It's the de-facto tool when issues arise or when troubleshooting or monitoring the environment. Well, XenServer offers a very similar tool, called xentop, which you can access from the command line of any XenServer host. When initiated, xentop will display what you see in Fig. 1:
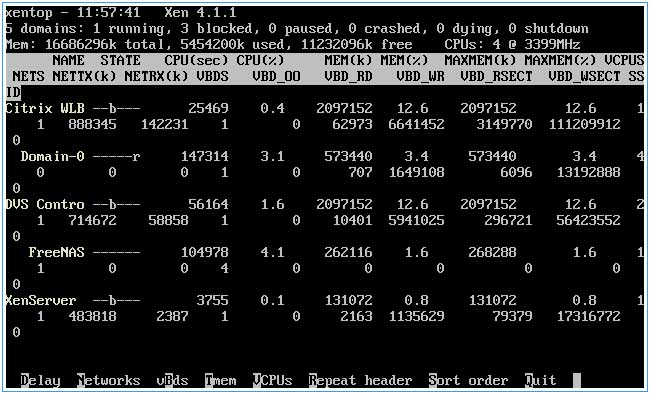 |
Figure 1. The xentop utility displaying in its austere, command-line glory. (Click image to view larger version.) |
and will give you access to the columns shown in the following table:
| Code |
What's Displayed |
| CPU(sec) |
domain cpu usage in seconds |
| CPU(%) |
displays cpu stats in percentage |
| VCPUS |
number of vCPUs |
| NETS |
number of virtual networks |
| MEM |
current memory |
| MAXMEM(k) |
maximum domain memory stats in KB |
| MAXMEM(%) |
memory stats in percentage, ratio of current domain memory to total node memory |
| NETTX |
number of total network transmits bytes statistic |
| NETRX |
number of total network received bytes statistic |
| VBDS |
number of virtual block devices |
| VBD OO |
number of total VBD OO requests |
|
A note on the last one: AFAIK, VBD OO refers to the number of times that VBD has encountered an "out of requests" error, which has resulted in IO requests for that VBD being delayed.
You can also gather information on the state of a virtual machine. In Fig. 1, you'll notice that some of the virtual machines running on the host have the state of "b." This means it is in a blocked domain state. This table show the other code definitions:
| Code |
Definition |
| d |
domain is dying |
| s |
domain shutting down |
| b |
blocked domain |
| c |
domain crashed |
| p |
domain paused |
| r |
domain is actively ruining on one of the CPUs |
|
Xentop has many other uses, but I just wanted to give you a bried introduction and make sure you were aware of it.
The other cool utility -- or maybe this is classified as just a tool or command -- is xsconsole. I particularly like this command because of its practical usefulness.
When you have the Xenserver host selected on the top left of the XenCenter display, click on the console tab and you will be connected to XenServer via SSH and you'll be given a command-line interface. It's great on its own because I don't have to use a separate tool like putty to connect, but what if I want access to the server's GUI? That usually means I have three options: connect via some kind of IP KVM, walk up to the server, or use something like an HP iLo. All these methods are feasible and easy to use, but they're also time-consuming, because then you need to find the tool or IP address, connect, authenticate, etc. At this point, you're just thinking, "Can I just get access, please?"
Well, from XenCenter select the XenServer host, click on the Console tab and type xsconsole. That will automatically display the text-mode GUI, per se, that you would see when walking up to the server. I love xsconsole -- it is not a huge deal, but the ability to get this type of access easily makes my day (I know, I know, I am lazy). Exiting out of this tool is also easy -- just scroll down to Quit.
Let me know if you're interested in more Xen-type insights.
Posted by Elias Khnaser on 04/23/2012 at 12:49 PM