How To Guy
How To Analyze Performance, Capacity with Foglight
Foglight Free Edition has enough capability to figure out your performance and capacity issues. Here's a look at the various tools.
Virtualization capacity analysis, performance, and inventory tools have been around for many years from Quest Foglight, vKernel vOPS, Veeam One, and others. And in recent years, VMware has validated the need for a capacity analysis and performance tool by offering vCenter Operations Manager.
These tools work to answer common questions that would otherwise be difficult to determine (with some tools giving better answers than others). For example, how many days until your virtual infrastructure runs out of capacity? How many more VMs can you add? What would happen if you doubled the RAM on all your servers to 32GB? What’s the peak I/O (IOPS) utilization of a datastore or by a VM? These are simple performance and capacity questions but can be difficult to answer by attempting to "guestimate" manually.
With the acquisition of vKernel, Quest acquired a vendor who offers strong capacity, optimization and chargeback reporting solutions. Now, with Dell acquiring Quest, Quest Foglight and vKernel vOPS are now all Dell products. With these changes, all products have been rebranded with the Foglight for Virtualization name and is available in three editions; Free, Standard and Enterprise. The Free Edition is based on the same virtual appliance as the Standard Edition and allows you try the Standard version (with a single click) as you need more advanced functionality with no loss of historical performance statistics. Free Edition supports VMware vSphere, vCloud Director, Microsoft Hyper-V and Red Hat Enterprise Virtualization and is Web based.
I recently tried the latest edition of Foglight for Virtualization Free Edition in my virtual infrastructure lab. The basic process is this:
- Download the virtual appliance.
- Use the Deploy OVF option in the vSphere Client.
- Size it according to the number of VMs in your environment; minimum system requirements are 2 vCPU and 4 GB Ram.
- Power on the VM and connect it to your centralized virtualization management application, which could be vSphere hosts, vCenter, vCloud Director, System Center Virtual Machine Manager, or Red Hat Enterprise Manager.
Free Edition is made up of six different tools, each represented as a single tab in the interface:
- Environment Explorer
- vScope Explorer
- SearchMyVM Explorer
- Storage Explorer
- Change Explorer
- Snapshot Explorer (new in the latest version)
In the past, some of the features from these tools were part of vKernel’s small, stand-alone free tools (like SearchMyVM and vScope). Let's take at Environment Explorer. It's a multi-hypervisor quick reporting tool that shows you things like:
- Number of VMs, Hosts, Datastores, Memory Limits, Snapshots
- Physical resources configured and physical resources available
- Virtual resources configured and virtual resources available
- Average host utilization
- Average VM utilization
- VM density
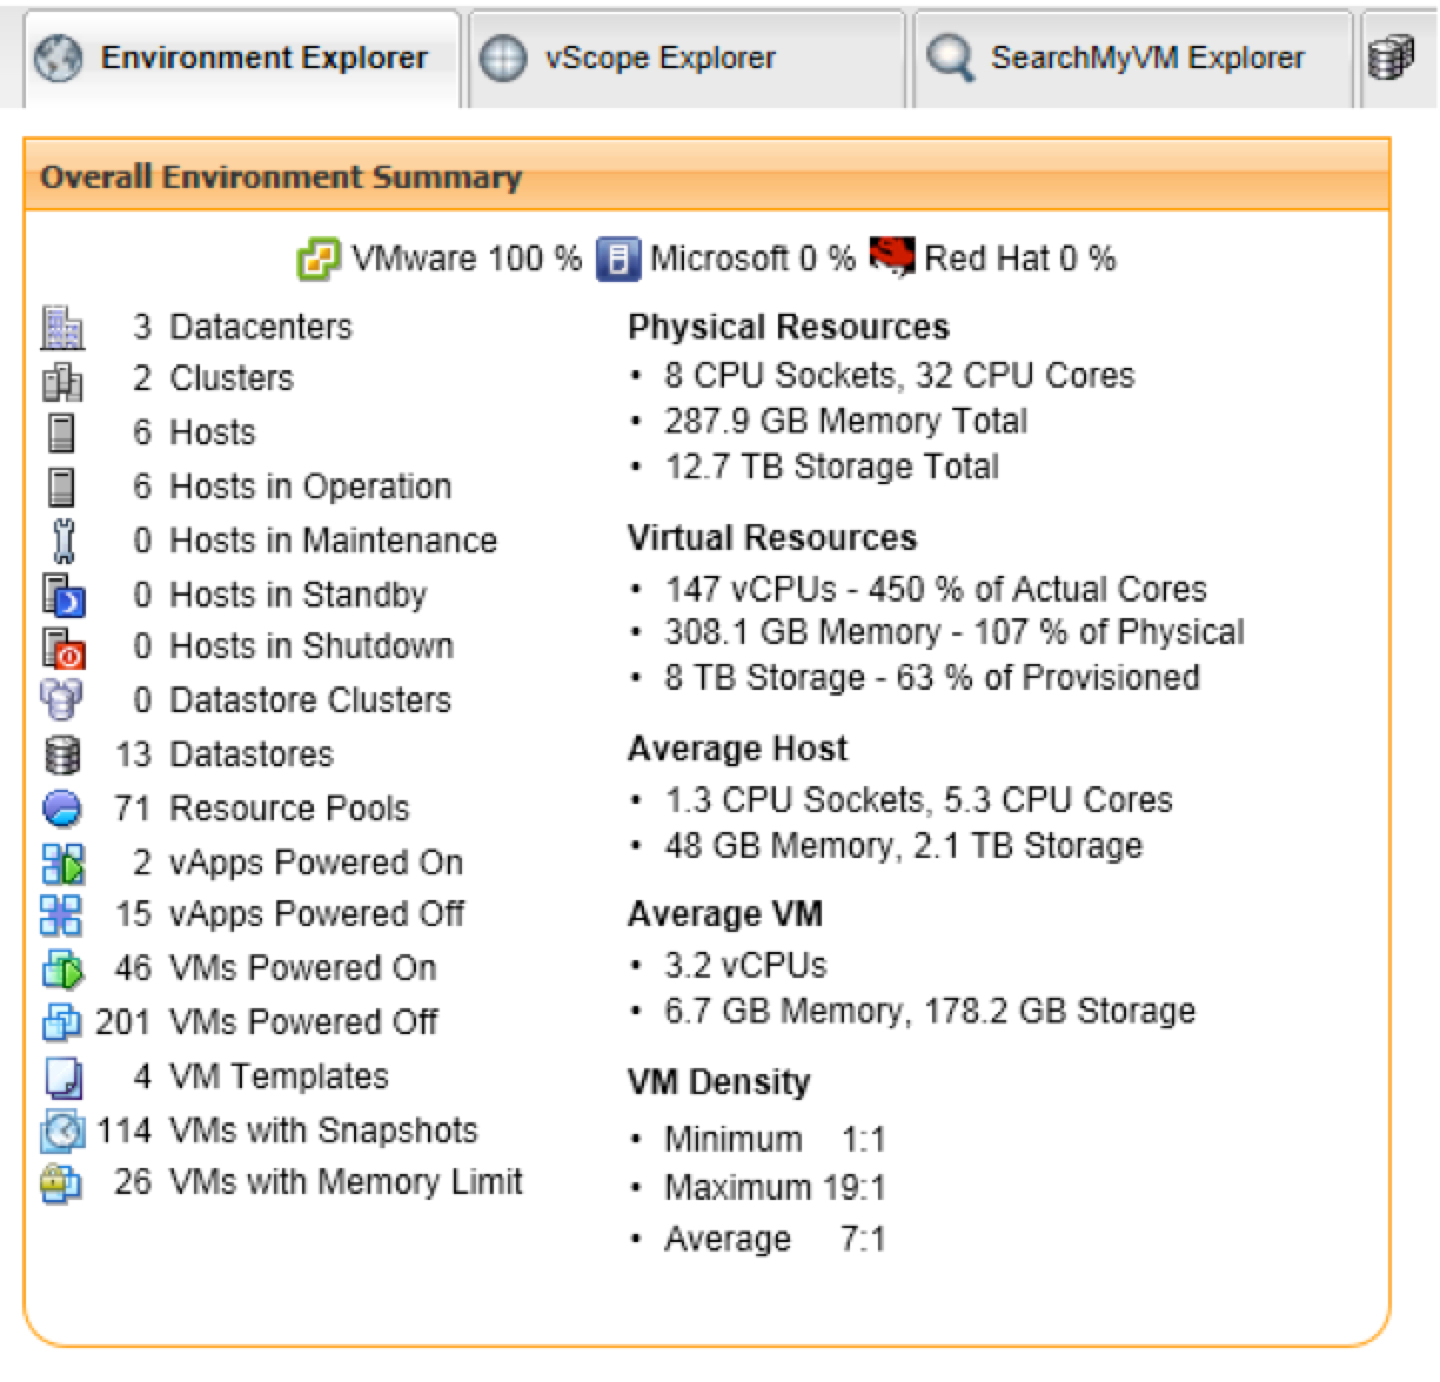 |
Figure 1. Environment Explorer provides quick report on your virtual infrastructure's general health. (Click image to view larger version.) |
This gives a great overview of your (potentially) multi-hypervisor virtual infrastructure and tells me some stats that I would have a difficult time trying to calculate (like VM density, physical to virtual resource utilization, or number of VMs with snapshots or memory limits).
I won't go into detail on every tool here, so here's a quick summary of what the other tools can do for you:
- vScope Explorer -- A performance, capacity and efficiency tool that uses a heat map to highlight issues across VMs, hosts and datastores
- SearchMyVM -- Gives a "Google-like" interface for your virtual infrastructure, allowing you to search, save searches, and export searches (nice for custom reporting)
- Storage Explorer -- Shows storage latency per datastore and per VM as well as capacity info per datastore and per VM; when a problem is detected that value turns yellow or red (depending on severity) and all columns are sortable by clicking on the column heading
- Change Explorer -- Correlates changes in the virtual infrastructure with performance changes and rates them on a risk impact scale; this is very useful (especially in large environments with multiple administrators) for identifying when a virtual infrastructure change has caused capacity or performance issues
- Snapshot Explorer -- Tells an admin just about everything they need to know about snapshots in use across their virtual infrastructure; it shows the total disk utilization of all snapshots, per VM utilization, oldest snapshots, and orphaned snapshots
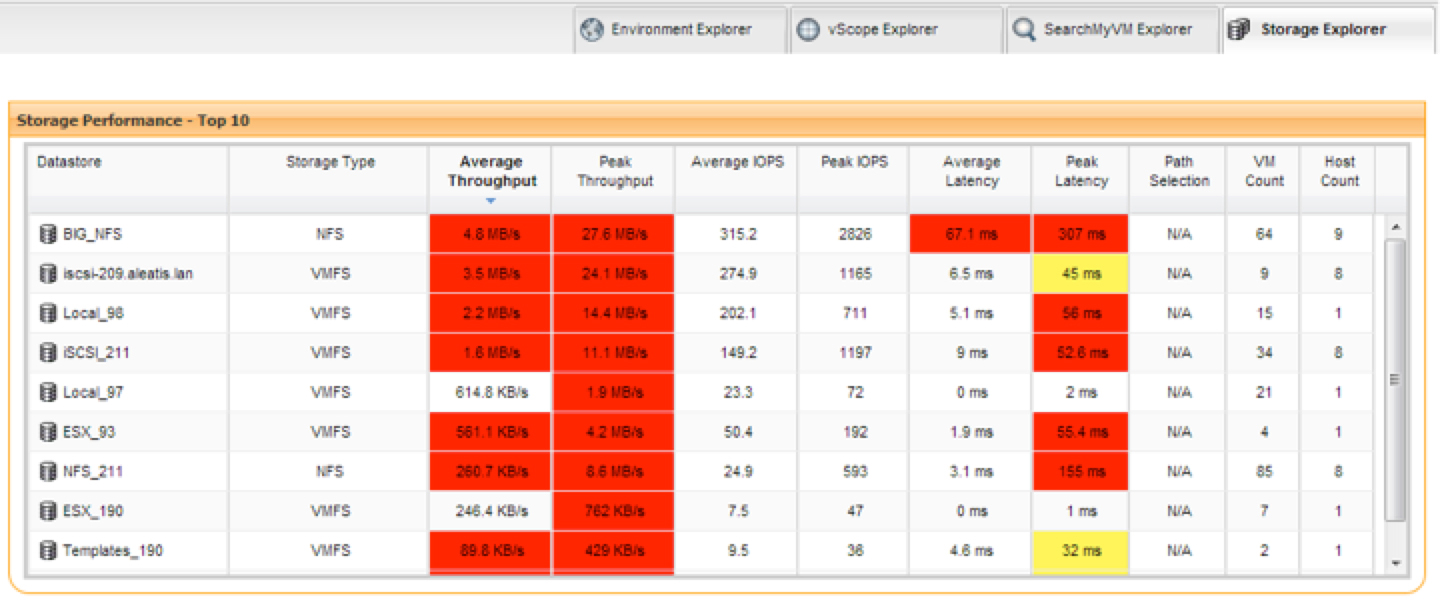 |
Figure 2. Storage Explorer will show a yellow or red indicator to highlight severity of problems that are taking place. (Click image to view larger version.) |
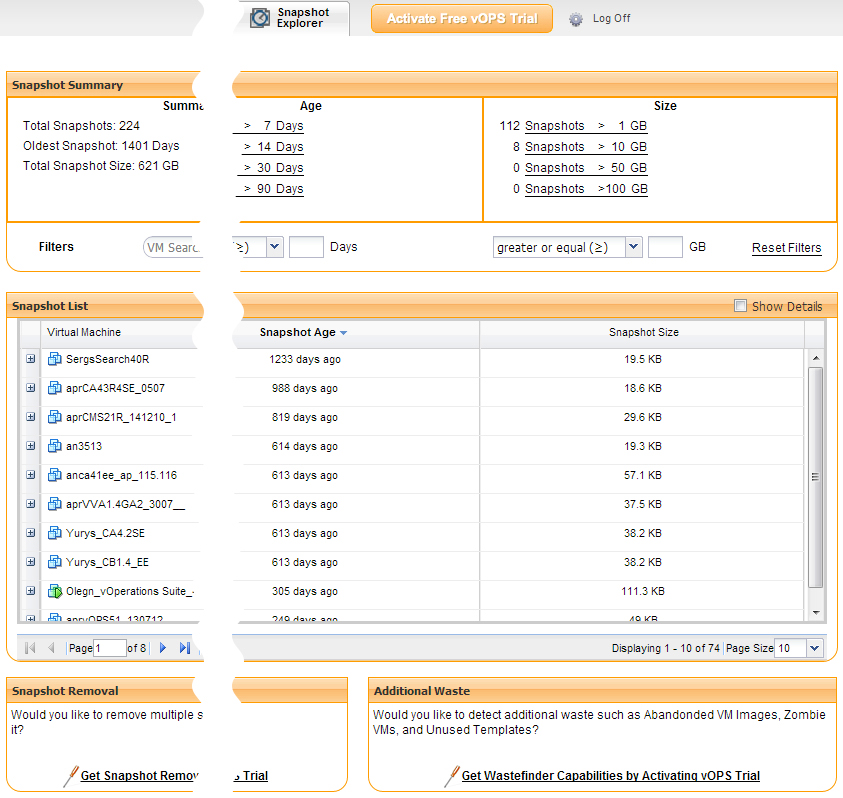 |
Figure 3. Snapshot Explorer gives a quick overview of the virtual infrastructure. (Click image to view larger version.) |
Overall, I am impressed with all the Dell Foglight for Virtualization, Free Edition does, at no cost. While some vendors seem to have backed off their free tools strategy, I am pleased that Dell continues what vKernel started, by developing and strengthen ing its free tools. Foglight for Virtualization is the kind of free tool I would recommend anyone have in their environment to help them more quickly find and solve capacity and performance problems.
About the Author
David Davis is a well-known virtualization and cloud computing expert, author, speaker, and analyst. David’s library of popular video training courses can be found at Pluralsight.com. To contact David about his speaking schedule and his latest project, go to VirtualizationSoftware.com.