How-To
Using DTrace for Windows
DTrace isn't a magic cure all for your system and applications, but it's an extremely powerful tool that can make it easy to monitor, troubleshoot and examine your system. Here's how.
DTrace is a performance analysis and troubleshooting tool that was originally developed in 2005 by Sun Microsystems for Solaris that allows you to attach probes to a running system and get an unparalleled view as to what that process is doing, such as seeing all the system calls that a process is doing. Over the years DTrace has been ported to Mac OS X, FreeBSD, QNX and Linux systems. Microsoft announced in September 2018 that it had ported DTrace to Windows. It's now available with Windows 10 Insider Build 18342 and hopefully will make it into the production version of Windows 10 and someday on Windows Server.
This article will be a little different than other articles I've written as I won't go in depth on what DTrace is; I'll just give you a bit of a teaser on it, and you'll either understand the power of DTrace and how it can help you, or you'll have used DTrace on a different platform and will be very excited that you'll be able to use it on Windows. After a brief introduction to DTrace, I'll explain how I installed it, give you some examples of how to use DTrace and then give you my final thoughts on Microsoft's port of DTrace to Windows.
Introduction to DTrace
Developers that use DTrace love it because it gives them not only a comprehensive view of their overall systems performance, but it can also be used to investigate a single process. DTrace tracks kernel function calls and examines properties of running processes -- it can even be used to examine low-level processes such as device drivers. DTrace has a built-in scripting language, which you can use to specify what information you want to obtain and how you want to report that information. No, DTrace isn't a magic cure all for your system and applications, but it's an extremely powerful tool that can make it easy to monitor, troubleshoot and examine your system. Be aware that DTrace is very invasive and does require your Windows system to be booted with the kernel debugger attached to it.
Installing DTrace
In order to use DTrace you need to be running Windows 10 x64 Insider Build 18342 or higher; you can read my article on how to get a Windows Insider Build here. Once I was running a supported Windows build (build 18855) I enabled DTrace by doing the following:
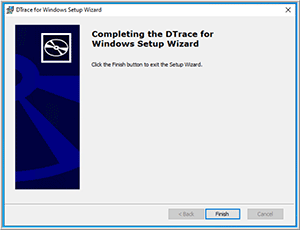
- Downloaded and installed the DTrace user mode components, drivers and so on from the Microsoft download center, which required a system restart (Figure 1)
- Brought up a Windows Command prompt in administrator mode and entered the following:
- bcdedit /set dtrace on
- mkdir c:\symbols
- set NT_SYMBOL_PATH=srv*C:\symbols*http://msdl.microsoft.com/download/symbols
- set PATH=%PATH%;"C:\Program Files\DTrace"
- Rebooted my Windows system
 [Click on image for larger view.]
Figure 1. DTrace for Windows Setup Wizard.
[Click on image for larger view.]
Figure 1. DTrace for Windows Setup Wizard.
Using DTrace
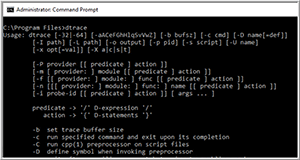
I then logged back on and brought up a Windows Command prompt in administrator mode and entered dtrace in it. This brought up a list of the options that can be used with DTrace (Figure 2).
 [Click on image for larger view.]
Figure 2. Dtrace options.
[Click on image for larger view.]
Figure 2. Dtrace options.
The general format of the dtrace command is followed by provider:module:function:name. To test this I entered dtrace -lvn syscall::: to list (l) all the probes in verbose (v) mode, for probe descriptors (n). This displayed the parameters for all of the NTOS syscall. More than 900 probes were listed (Figure 3). You can also get the information for a specific function; for example, to get a list of the NTOpenFile function you would enter dtrace -ln syscall::NtOpenFile:.
 [Click on image for larger view.]
Figure 3. The list of syscall probes.
[Click on image for larger view.]
Figure 3. The list of syscall probes.
Microsoft says that DTrace also has providers for; fbt - (Function Boundary Tracing) – Kernel function entry and returns, pid – User-mode process tracing, and etw Event Tracing for Windows.
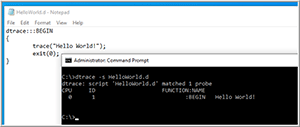
DTrace has a built-in scripting language called "D." Once I felt comfortable that DTrace was running as expected I tested it by creating a file called HelloWorld.d, which contained the following text:
  dtrace:::BEGIN
  {
    trace("Hello World!");
    exit(0);
  }
I then ran the script by entering dtrace -s HelloWorld.d (Figure 4).
 [Click on image for larger view.]
Figure 4. Running a D script.
[Click on image for larger view.]
Figure 4. Running a D script.
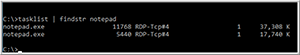
I then created a script to monitor a process and display what syscall's were being used by the process, in this case the process was notepad.exe. To get the process identifier (PID) of notepad.exe I entered tasklist | findstr notepad (Figure 5). I had two instances of notepad running, the one that I wanted had a PID of 11768.
 [Click on image for larger view.]
Figure 5. Getting the process identifier of notepad.exe.
[Click on image for larger view.]
Figure 5. Getting the process identifier of notepad.exe.
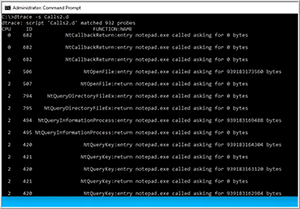
I then created script call Calls2.d with the following text:
syscall:::
  /pid == 11768/
  {
    printf ("%s called. Output of first argument is %d \n", execname, arg0);
  }
I then entered dtrace -s Calls2.d and examined the output (Figure 6). This showed all the syscalls being made to the process. I pressed CTRL C to end the dtrace of this process.
 [Click on image for larger view.]
Figure 6. The Calls2.d output.
[Click on image for larger view.]
Figure 6. The Calls2.d output.
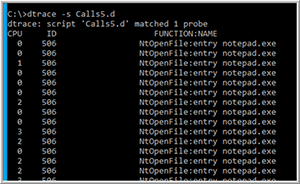
The output indicated that 932 probes were being used, and many different types of syscalls were being called. I wanted to only see if NtOpenFile was being called so I modified the script to this:
  syscall::NtOpenFile:entry
  /pid == 11768/
  {
    printf("%s", execname);
  }
The script now only displayed the NtOpenFIle syscalls (Figure 7).
 [Click on image for larger view.]
Figure 7. NtOpenFile output.
[Click on image for larger view.]
Figure 7. NtOpenFile output.
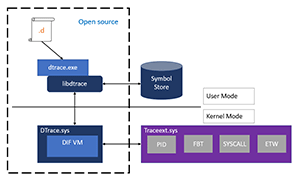
DTrace Architecture
Microsoft hasn't written a lot on DTrace but I was able to find Figure 8 in this article from Microsoft, which shows how DTrace interacts with the Windows Kernel.
 [Click on image for larger view.]
Figure 8. The DTrace architecture. [Source: Microsoft]
[Click on image for larger view.]
Figure 8. The DTrace architecture. [Source: Microsoft]
Caveats and Wrapping Up
DTrace does have some limitation such as only working with 64-bit processes and if you use Window's Kernel Patch Protection (KPP, aka PatchGuard), which monitors certain pieces of kernel memory to look for modifications, it will crash the system if they're detected.
DTrace is a recent addition to Windows 10 and hasn't been documented very well yet but I'm excited to see that Microsoft has seen fit to start working with it and include it.
About the Author
Tom Fenton has a wealth of hands-on IT experience gained over the past 30 years in a variety of technologies, with the past 20 years focusing on virtualization and storage. He previously worked as a Technical Marketing Manager for ControlUp. He also previously worked at VMware in Staff and Senior level positions. He has also worked as a Senior Validation Engineer with The Taneja Group, where he headed the Validation Service Lab and was instrumental in starting up its vSphere Virtual Volumes practice. He's on X @vDoppler.