How-To
Grafana Open-Source Data Visualization Solution, Part 1
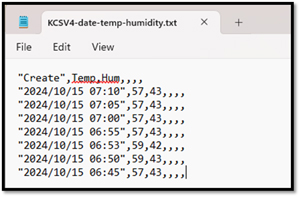
I have been meaning to write about Grafana for years. I started a half-dozen articles on it but ended up abandoning them because I couldn't get it to do a relatively simple task: making a graph from a CSV data set. This is not a slam on Grafana, as I have seen it do an excellent job of using other data sources to make dashboards full of graphics. I just couldn't figure out an easy way to use CSV data with Grafana.
Below is an example of the data that I wanted to use.
 [Click on image for larger view.]
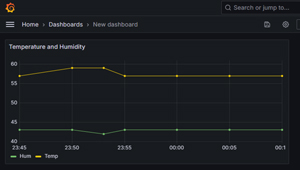
And how I wanted to visualize it.
 [Click on image for larger view.]
The above is a simple example of what I want to do, just so I could get a feel for using Grafana. To be fair, Grafana is a far more helpful tool for visualizing real-time data than creating a single graph with static information. But still, I wanted a really easy example to start with.
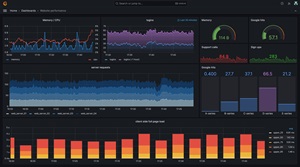
The example below shows a Grafana dashboard that monitors a website in real-time, a task for which Grafana was designed.
 [Click on image for larger view.]
Then, I stumbled upon a Grafana plugin that allows me to use CSV files with Grafana. As a bonus, it can also use other text-based formats like JSON, XML, etc., as data sources. However, I couldn't find much information on how to use it and found it had a few gotchas. So, in this article, I will cover what Grafana is and how to use it, the Grafana plugin that lets you use CSV data sources to create a dashboard like the one shown above, and an overview of Grafana.
What is Grafana?
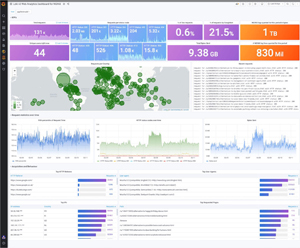
Grafana is a wildly popular free, open-source software tool for visualizing data in a web browser. The backend runs on Windows, Linux, and other OSes or in the cloud. The visualizations are wide-ranging, including standard charts and graphs and more exotic ones like Sankey diagrams. They are displayed as panels on a dashboard, which can automatically and dynamically update the display to show it in real-time or as historical data.
 [Click on image for larger view.]
Grafana is a well-established product. It was founded in 2014 and is reported to have over 20 million global users in all the major industries. Its users range from home users like me to heavyweights like eBay, Bloomberg, and NVIDIA, and it has over 1,000 paying customers.
 [Click on image for larger view.]
Enterprise vs. Open Source Grafana
As mentioned above, Grafana is free but also offers an enterprise version. Unlike the free version, this version has features tailored for enterprise users. These include enhanced reporting and sharing capabilities, finer RBAC control, and additional integrations with enterprise-level data sources such as Datadog, Splunk, New Relic, AppDynamics, and Oracle. I love their thinking about charging customers for using it: "We figure if you are a paying customer of any of these companies and derive value from having that data available in Grafana, then you can also be a paying customer of Grafana Labs."
I will be using the free version in this article.
Installing Grafana on Windows
For this article, I will be installing and using it on a Windows 11 laptop.
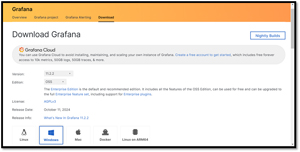
Grafana does a good job of explaining how to install it, so I will only review the process's highlights here. You can read the full installation instructions here and Grafana can be downloaded from here.
 [Click on image for larger view.]
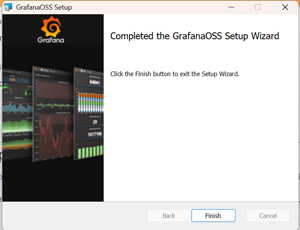
You can download an installer or the standalone Windows binaries. I opted to use the installer. I had no issues installing it; it took less than a minute.
 [Click on image for larger view.]
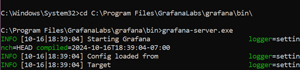
Grafana can be manually started or run as a service. I opted to manually start it by changing to the directory where it was installed (C:\Program Files\GrafanaLabs\grafana\bin\) and entering grafana-server.exe in a command window that I started with administrator privileges.
 [Click on image for larger view.]
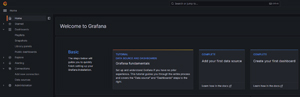
Even though I got a few WARN and ERROR messages, I could still go to http://localhost:3000 on my web browser and access its web portal, where I was queried for a username and password. I used the default user of admin and the default password of admin. I was then prompted, for security reasons, to change the password.
After doing so, a home page with links to a tutorial was displayed, along with the option to add a data source or create a new dashboard.
 [Click on image for larger view.]
In this article, I looked at Grafana, a powerful open-source tool for visualizing real-time data. I have tried to use it in the past but was frustrated by its lack of native CSV support. After years of searching, I finally found a plugin that solved the issue, which allowed me to create a simple CSV-based graph. In my next article, I will show you how I did this. In other articles, I will use it to pull and display performance metrics from my laptop and create a Sankey diagram to show network traffic, which is more aligned with what Grafana was designed for.
About the Author
Tom Fenton has a wealth of hands-on IT experience gained over the past 30 years in a variety of technologies, with the past 20 years focusing on virtualization and storage. He previously worked as a Technical Marketing Manager for ControlUp. He also previously worked at VMware in Staff and Senior level positions. He has also worked as a Senior Validation Engineer with The Taneja Group, where he headed the Validation Service Lab and was instrumental in starting up its vSphere Virtual Volumes practice. He's on X @vDoppler.