VMware Tools Has Perfmon Integration
Current versions of VMware Tools as well as VI3 installations are now able to use Windows Perfmon to gain access to selected CPU and RAM counters provided by VMware Tools. I came across this information reading this
VPivot blog post.
With the new versions of VMware Tools (or the standalone update for older versions of Tools), two new performance objects appear: VM Processor and VM Memory. These have access to host stats for the VM, and make it incredibly easy to centrally collect information. Some of the new counters include:
VM Processor
- %Processor time
- Effective VM speed in MHz
- Host processor speed in MHz
- Limit in MHz
- Reservation in MHz
- Shares
VM Memory
- Memory active in MB
- Memory ballooned in MB
- Memory limit in MB
- Memory mapped in MB
- Memory overhead in MB
- Memory reservation in MB
- Memory shared in MB
- Memory shared Saved in MB
- Memory shares
- Memory swapped in MB
- Memory used in MB
A sample of the new counters are shown in Fig. 1.
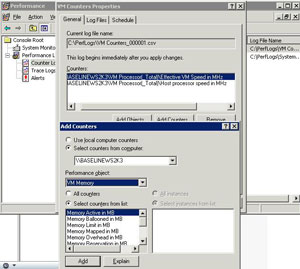 |
| Figure 1. VMware Tools can now provide data to Windows performance counters, making an easy connection between the virtual platform performance and the OS. (Click image to view larger
version.) |
I think this is great, but don't make it too public. I don't want to have to explain shares and swapping to application owners who may still have the perception that virtualization has a cost to running their applications.
Have you used this yet? Send me an e-mail with any points you have learned to [email protected] or drop a comment below.
Posted by Rick Vanover on 10/01/2009 at 12:47 PM