How-To
How To Use the vCenter Server Appliance Management Interface (VAMI)
See how to access the VAMI and use some of its features to perform basic administrative tasks, including monitoring your VCSA and applying patches and upgrades, among others.
The vCenter Server Appliance Management Interface (VAMI) is the administration Web interface for the vCenter Server Appliance (VCSA), and is used to perform basic administrative tasks such as monitoring the VCSA, changing the host name and the network configuration, NTP configuration, and applying patches and updates. The VAMI was included in the early versions of VCSA, but was removed by VMware in vSphere 6.0 and then reintroduced once more in vSphere 6.0 U1. The revamped VAMI uses HTML and has a new look and feel. In this article, I'll walk you through how to access the VAMI and use some of its features. I'll be using the VAMI included with VCSA 6.7; if you're using a different version of the VCSA, it's possible that not all the features discussed in this article may be available to you.
Accessing the VAMI
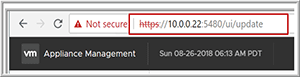
To access the VAMI, postfix :5480 to the IP address or URL of your VCSA in a Web browser; for example, https://10.0.0.22:5480 (Figure 1) will attach you to the VCSA with an IP address of 10.0.0.22. You'll then be presented with a login screen where you log in as root with the password you specified when you installed the VCSA.
 [Click on image for larger view.]
Figure 1. Accessing a VCSA.
[Click on image for larger view.]
Figure 1. Accessing a VCSA.
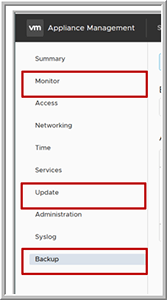
Once logged on to the VCSA, on the left side of the Web page you'll find a menu of the various features and functions that you can perform on the VCSA (Figure 2). In this article, I'll be looking at just at few of these functions: Update, Backup and Monitor, focusing on the Monitor feature for the majority of this article.
 [Click on image for larger view.]
Figure 2. The VAMI menu.
[Click on image for larger view.]
Figure 2. The VAMI menu.
Update
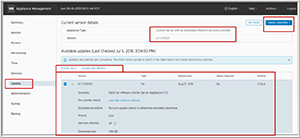
One of the most critical tasks you can perform to make sure that your VCSA is safe, secure and reliable is keeping it updated, and the VAMI has a feature included that makes the upgrade process as painless as possible. When you click the Update tab, a screen will appear with current version details (Figure 3). In the upper right-hand corner of the screen is the Check Update button, which will download a list of the latest patches and updates for your VCSA from VMware. Once the list is downloaded you can click on the patch to review important information about it, including its criticality, the size of the download and whether will require a reboot of your VCSA. To install the patch or upgrade, you can select Stage Only or Stage and Install. If you select Stage Only, it will only download the patch and then later you'll have the option to install it when you see fit.
 [Click on image for larger view.]
Figure 3. The VAMI Update window.
[Click on image for larger view.]
Figure 3. The VAMI Update window.
Backup
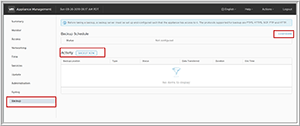
You should back up your VCSA on a regular basis, especially before you perform a major operation on your VCSA such as updating it. The VAMI tool includes a powerful backup tool (Figure 4) that lets you back up the data on your VCSA either on demand or on a set schedule. This tool is unique in that, in order to be as space efficient as possible, it only backs up the data on the VCSA and not the entire VCSA. To restore the VCSA, you reinstall the VCSA and then restore the backed up data on it. The restore process can be initiated from the VCSA installation ISO.
If you're not already using another tool to back up your VCSA, you should investigate using this tool. Check out my previous article on using the VCSA backup tool, "How To Back Up a vCenter Server Appliance."
 [Click on image for larger view.]
Figure 4. The VAMI Backup window.
[Click on image for larger view.]
Figure 4. The VAMI Backup window.
Monitoring
The VAMI monitoring feature gives you insight into what's happening with your VCSA. You can use it to monitor the VCSA's CPU, memory, network activity, and storage and database utilization by clicking on the appropriate tab after selecting the Monitor menu tab.
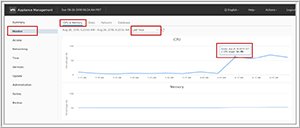
The VCSA's CPU and memory activity are displayed on the same page (Figure 5). If you hover over any given point on the activity line on the graph, it will you give more detailed information about what's happening at that particular point of time. From the Time dropdown menu, you can choose to see the activity for the previous hour, day, week or month. You need to keep in mind that the CPU scale goes from 0 percent to 100 percent utilization and doesn't separate out the activity by the individual vCPUs of the VCSA VM; for example, if you're showing 25 percent utilization and your VCSA has four vCPUs, this could mean that the workload is being divided evenly between each vCPU, but it could also indicate that one vCPU is being utilized 100 percent of the time. Many services that run on the VCSA are single-threaded, so you do need to keep this in mind. If you suspect that a single vCPU is being heavily utilized, you can monitor the CPU activity of the VCSA on a per-CPU basis from the vSphere client or by using vimtop.
The memory graph line tends to ramp up and then stay constant; this is to be expected as programs tend to reside in memory until a more active process needs the memory, at which point the less-active process will be swapped out to disk and the more active process will reside in real memory.
 [Click on image for larger view.]
Figure 5. The VAMI Monitoring CPU & Memory tab.
[Click on image for larger view.]
Figure 5. The VAMI Monitoring CPU & Memory tab.
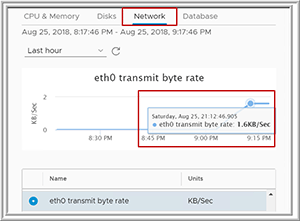
The Network monitoring tab, used to monitor a VCSA's network activity (Figure 6), is different from CPU & Memory monitoring in that the Network page will only display one network counter at a time; you'll need to click through the list of these counters to get an accurate portrayal of the network activity of the VCSA. Although these counters should be monitored, networking is usually not an issue with the VCSA.
 [Click on image for larger view.]
Figure 6. The VAMI Monitoring Network tab.
[Click on image for larger view.]
Figure 6. The VAMI Monitoring Network tab.
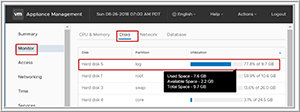
Unlike the CPU & Memory and Network tabs, the Disks and Database tabs indicate the utilization of these objects rather than their current activity. The VCSA is a Linux system (Photon OS), which is maintained by VMware and has been optimized to run on ESXi. The VCSA has a standard Linux filesystem and needs to be monitored to ensure that the filesystems are kept below 90 percent because they don't tend perform well when they fill up beyond that. Unfortunately, the Disks page (Figure 7), by default, is sorted by the name of disk rather than the utilization of the disk. To sort by utilization, click the Utilization column.
 [Click on image for larger view.]
Figure 7. The VAMI Monitoring Disks tab.
[Click on image for larger view.]
Figure 7. The VAMI Monitoring Disks tab.
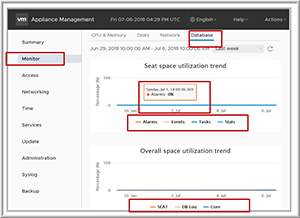
The Database monitoring tab (Figure 8) is arguably the most important as the information that it provides is not easily obtained by any other means. The VCSA uses a Postgres database to store persistent information for the VCSA. The Database page is divided into two charts: Seat space and overall space utilization trends. The Seat section displays the statistics, events, alarms and stats. These different categories can be displayed as graph lines by clicking on their names below the Seat graph.
The total Seat utilization is shown in the bottom graph, as well as the DB log and core utilization; these graph lines can also be removed from the graph by clicking on the associated name below the graph. If any of these sections start to fill up, the reason for this anomaly should be investigated and appropriate actions should be taken to ensure that the VCSA data performs as expected.
 [Click on image for larger view.]
Figure 8. The VAMI Monitoring Database tab.
[Click on image for larger view.]
Figure 8. The VAMI Monitoring Database tab.
Wrapping Up
The VCSA has become the de-facto standard in most datacenters for managing a vSphere environment. For your vSphere environment to run most efficiently, you'll want to ensure that the processes running on your VCSA have the resources that they need; by using the VAMI, you can monitor the VCSA and detect abnormalities. You can also use the VAMI to update and back up your VCSA to ensure that it's patched to the most recent version so that, in the case of a catastrophic event, it can be recovered easily and efficiently.
About the Author
Tom Fenton has a wealth of hands-on IT experience gained over the past 30 years in a variety of technologies, with the past 20 years focusing on virtualization and storage. He previously worked as a Technical Marketing Manager for ControlUp. He also previously worked at VMware in Staff and Senior level positions. He has also worked as a Senior Validation Engineer with The Taneja Group, where he headed the Validation Service Lab and was instrumental in starting up its vSphere Virtual Volumes practice. He's on X @vDoppler.