How To Guy
Analyzing vSphere Performance with Free Xangati
I first learned about Xangati just before VMworld 2010. The free Xangati for ESX was launched, and I tried it for myself to find out why the tool was different from other virtual infrastructure performance-monitoring solutions. I found that it offers at least four clear-cut advantages over other virtualization-performance tools:
- It pulls not only vSphere performance metrics from ESX using VMware APIs, but also generates NetFlow statistics by summarizing all the traffic traversing the vSwitches on the ESX server. This is something that no other virtualization performance tool (that I've seen) offers today.
- Its performance dashboard can be "rewound" like a DVR/TiVo to go back in time and see what was happening when you had a problem in the virtual infrastructure.
- It's deployed in Open Virtualization Format (OVF) to make installation easier and faster, so no Windows OS, application or database needs to be installed.
- It offers a fully functional free tool that monitors a single ESX host.
Analyzing Virtual Network Traffic
Xangati for ESX analyzes traditional vSphere performance information such as CPU, RAM and Storage I/O utilization per server and virtual machine (VM), but that's not its most outstanding quality. Its ability to combine these key metrics and the Xangati virtual network traffic analysis in the same dashboard is what makes it unique. With the Xangati network insight you can monitor utilization of critical network applications, drill down into applications on the network to see which VMs are using them, and view the most important applications and protocols that are in use on the vSwitch.
Certainly there are limitations to any free tool. Note that, with free Xangati for ESX, you're limited to monitoring just a single ESX server with your dashboard.
Improvements
Recently, Xangati has made some major product improvements. First, Xangati for ESX now offers a much easier installation and initial configuration than before. Second, Xangati for ESX Pro now offers a Virtual Desktop Infrastructure (VDI)-specific dashboard, a new UI and a Xangati Health Index. With Xangati for ESX being such a useful tool for VDI, the VDI dashboard makes sense because it gives VDI admins exactly the information they need in one dashboard. I like the Health index because it automatically creates baselines so Xangati for ESX can alert you when there's abnormal activity on the virtual network.
You can see what the new Xangati for ESX Pro dashboard and VDI dashboard look like in Figure 1.
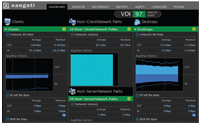
[Click on image for larger view.] |
| Figure 1. The Virtual Desktop Infrastructure-based dashboard in Xangati for ESX. |
I think of virtualization admins being like Batman because, just like the caped crusader, we need multiple tools in our utility belts. Xangati is one of the tools I want to make sure I have handy because I feel that it gives me insight around the virtual network that no other tool can (and at no cost!). You can download the free Xangati for ESX at xangati.com.
About the Author
David Davis is a well-known virtualization and cloud computing expert, author, speaker, and analyst. David’s library of popular video training courses can be found at Pluralsight.com. To contact David about his speaking schedule and his latest project, go to VirtualizationSoftware.com.