Virtual Microsoft
Using Microsoft Operations Management Suite, Part 2
How to use Solutions to ease administration.
Click here for Part 1
If you followed along with the instructions in Part 1, you now have a working Operations Management (OMS) workspace and at least one server with the OMS agent installed and uploading log data. Log in to your workspace at www.microsoft.com/OMS and click on the Solutions gallery tile.
Solutions
The real power of OMS lies in the available solutions (in earlier incarnations of OMS, these solutions were called Intelligence Packs.) These solutions are all free and provided by Microsoft. New solutions show up on a regular basis in preview form until they've been tested in the real world. Third-party and paid solutions are coming in the future.
Each solution focuses on analyzing your log data for a specific purpose or product. The basic ones cover your infrastructure (the servers generating the data can be in your own data center, in Azure or in any other public cloud), including:
- Active Directory (AD)
- AD Replication
- Azure Site Recovery
- Backup
- SQL Server
- Configuration Assessment
- Change Tracking
- Security Insight
- Patching Assessment
Simply pick a solution, click the Add button and the tile will be added to your main dashboard. Depending on the solution, it may take some time before useful data is surfaced. Note that the anti-malware solution relies on the Windows Security Center being installed, which on Windows Server comes with the desktop experience feature.
 [Click on image for larger view.]
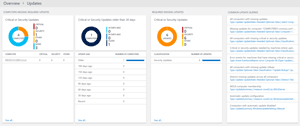
Figure 1. A system overview for four servers.
Taking the System Update Assessment as an example (see Figure 1), I can see that across my client's four production servers I'm missing six critical updates, and I can see exactly which server needs patching. On the right hand side is a list of common queries; clicking on one of these will drill down into that particular view of the patching state of the servers.
 [Click on image for larger view.]
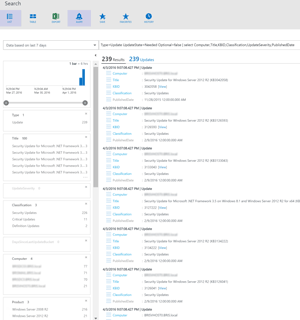
Figure 2. An Update Assessment result chart, showing security updates only.
Once that's executed, I now see "facets" on the left hand side; this is where I can fine tune the result set. As shown in Figure 2, for instance, I can choose to only see security updates, not critical or definition updates. Or I could limit the results to a particular OS version. I can also control the time range for which the results are displayed with the slider bar and the drop down list in the top left box. Along the top I can choose to see the resulting data as a list or as a table as well as export the data to Excel (there's a limit of 5,000 lines in the exported spreadsheet). I can also build an Alert based on this particular query; more on this later.
Another nice benefit of the Update Assessment solution is that it'll tell you how long a particular patch or group of patches will take to install; this data is based on the aggregated data for each patch by all OMS users. This means you'll be able to plan your change management window based on more accurate data.
On top of the basic infrastructure solutions is added Alert Management and Automation. In preview, or coming soon at the time of this writing, are solutions for Office 365, Wire data (on-premises), Azure Networking analytics, Key Vault, Upgrade analytics, App Dependency monitor, Containers (Docker), Network Performance Monitoring and Service Fabric.
Some solutions, such as Alert Management and Configuration Assessment, require that OMS is connected to Operations Manager (OM). Don't worry if you've added a solution that you later realize you don't need; just go back to the solutions gallery, select the Solution and click Remove. This is a lot easier than removing a management pack (MP) from Operations Manager.
Alert Management works by displaying alerts from your OM infrastructure in the OMS console; Configuration Assessment will let you know about potential configuration issues in Exchange and other workloads based on OM MP data.
If you use OMS to monitor Internet Information Server (IIS) logs, it's a good idea to wrap them hourly rather than the default once a day. They can grow quite large, and if they're changed before the upload completes, the upload will start all over again.
The Automation solution ties in with Azure automation, and provides 500 free minutes of automation jobs per month. You also get Azure Backup and Azure Site Recovery free for the first 31 days with OMS.
Search
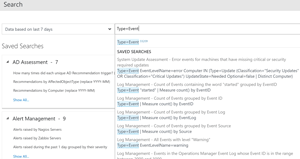
Solutions deliver actionable insight for a particular workload or aspect of your infrastructure. But if you need to customize the results, the search functionality (Figure 3) is your friend.
 [Click on image for larger view.]
Figure 3. Performing a search.
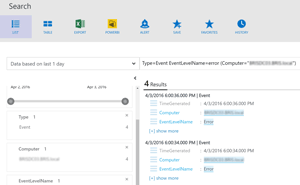
Through a straightforward search syntax you can look at the entire data set of your machine data, then narrow it down to exactly the stuff you're interested in. Go to the home screen and click on the Log search button. Start typing Type=Event and OMS will suggest likely searches to perform. In my sample search, shown in Figure 4, I used Type=Event EventLevelName=error and then used the facets on the left to narrow the results to a single server.
 [Click on image for larger view.]
Figure 4. The search dashboard.
Alerts
[Click on image for larger view.]
Figure 4. The search dashboard.
AlertsNo monitoring solution is complete without alerting you to issues needing immediate action. For OMS, this feature is in preview at the time of writing. To use it, head over to the settings button and select the Preview Features area, then Enable Alerting and Alert Remediation.
 [Click on image for larger view.]
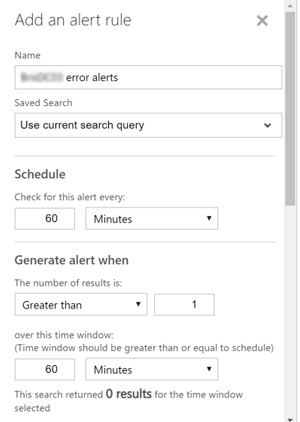
Figure 5. A customized Alert rule.
Alerts are based on a search query, so following on from the test above where we built a custom query, click the Alert button and give the alert a name (see Figure 5). You also need to define how often OMS should check, the instance count over a specified period of time, and if an email should be sent when the alert is triggered. If the alert is something that could be remediated using Azure automation, you can enable that functionality as well.
My Dashboard
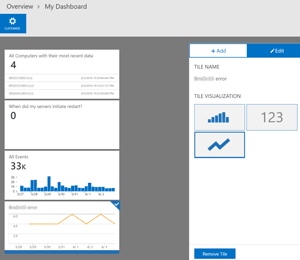
If your custom search result is something you'd like to see on an ongoing basis, save the search and create a dashboard from it. Head back to the home screen and click My Dashboard, then the customize button. On the right hand side you'll have a list of suggested queries, with your recently saved query at the end of the list (
Figure 6). Click the Add button to create a new tile based on it. Click on the tile and you can choose from three types of visualizations: bars, numerical and trending graph.
 [Click on image for larger view.]
Figure 6. A customized dashboard, created from a saved search.
Performance Monitoring
Near Real Time (NRT) performance counter collection is configured in Settings/Data; select the counters you want to collect. Give it some time to collect some performance data, go back to Search and type in Type = Perf. You can limit the data to a single computer, select a particular counter and even a particular instance. Figure 7 shows a graph for disk transfers per second for a single volume on a particular server.
 [Click on image for larger view.]
Figure 7. A performance monitoring graph showing disk transfers.
PowerBI
A recently introduced feature is the ability to visualize OMS data using PowerBI. Go to Settings, Preview Features and turn on PowerBI integration. Go to Accounts and click on Connect to PowerBI account; if you don't have one yet, create one at https://powerbi.microsoft.com.
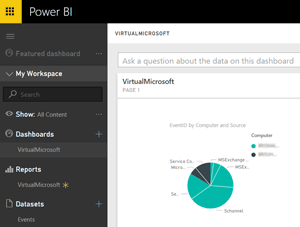
Now go to Search and type in Type = Events or any other data type you'd like to visualize. Once the results have shown up, as in Figure 8, click the yellow PowerBI button and give your new rule a name. The shortest current data synchronization interval from OMS to PowerBI is 15 minutes. Settings/PowerBi displays the datasets you've set up and if they've synchronized yet. Log in to PowerBI and click the menu to see your datasets. Pick a visualization and start playing. For more guidance, see "Resources".
 [Click on image for larger view.]
Figure 8. The PowerBI dashboard.
Resources
OMS is quickly becoming a very capable platform. Here are some good resources for you to dig deeper into OMS. A great place to start is the
OMS survival guide, which has categorized links to many other resources.
- If you really want to go deep (449 pages, to be exact) into OMS, there's no better resource than this free ebook by Pete Zerger, Tao Yang, Stanislav Zhelyazkov and Anders Bengtsson.
- The OMS blog has some great posts on alerting, performance counter collection, Disaster Recovery & ASR, Linux Syslog collection, Security solution, Azure integration, AD replication monitoring, Alert remediation, Azure RemoteApp integration, WebHook support, as well as PowerBI integration (and again here).
- A very recent addition is the User voice voting, which appears in the console. It allows you to vote on features you feel are most important.
A Worthy Addition
I've been a systems administrator and consultant for nearly 25 years, and I can tell you that analyzing log files manually, looking for correlation or causation, is incredibly tedious and error prone. OMS provides insights that were in the log files all along but missed, usually because of an inability to "connect the dots" due to lack of time or resources.
One question I frequently get is "Will OMS replace OM?" Today, the answer is no. Solutions aren't customizable to the degree that MPs are, and there's lots of platforms and systems that aren't yet supported by OMS. They do complement each other very nicely, and I suspect that soon OMS could be a good replacement for a smaller environment.
Another question is the overhead incurred by the OMS agent. In my experience it's minimal, except some CPU processing during initial log upload when the servers are first connected. I would, however, keep an eye on busy DCs because of the log data volume generated on them.
Overall, I think Microsoft has a winner with OMS. The combination of cloud development cadence, big data analytics, machine learning, plumbing, and an easy-to-use console makes OMS a great value add for most IT environments.