How-To
Step-by-Step: Configuring the VMware UEM Debug Level
Tom Fenton walks you through the process of configuring the Debug level in VMware User Environment Manager.
VMware User Environment Manager (UEM) is an interesting product that allows you to have a central management portal that can control an end user's desktop Group Policies and settings. While I was recently working on some issues that I was having with UEM, which required me to troubleshoot, I couldn't find any step-by-step guide on how to increase the Debug level for UEM. I was, however, able to figure out how to do this after spending some time sifting through various documents and poking around various sources. Let me help make your life a little easier by showing you how.
Setting the Debug Level During Initial Install
When the UEM manager is installed, you need to use the Group Policy Management interface on your Active Directory server to set various UEM parameters, include logging. While doing this, you have the option to enable debugging, set the Debug level and specify the location of the log files. However, once the parameters are initially configured, the UEM manager interface doesn't have a specific place where you can change the Debug level.
Changing the Debug Level
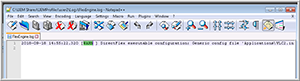
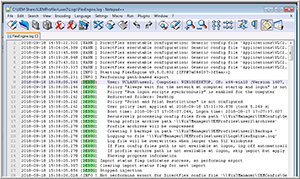
Before changing the Debug level, let's look at the UEM logs and review the level of detail captured in the log (Figure 1). Note, the log snapshot in Figure 1 is pretty empty as I'm only setting the log level to capture WARN errors.
 [Click on image for larger view.]
Figure 1. A WARN error in the UEM log file.
[Click on image for larger view.]
Figure 1. A WARN error in the UEM log file.
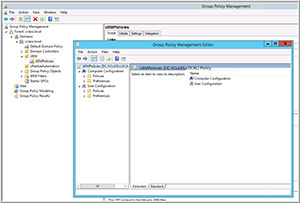
To change the log level, I needed to return to my AD server and bring back up the Group Policy Management interface. From the Group Policy Management Editor, I navigated to Domains | <domain name> | UEM, then right-clicked UEMPolicies and selected Edit (Figure 2).
 [Click on image for larger view.]
Figure 2. The Group Policy Management Editor.
[Click on image for larger view.]
Figure 2. The Group Policy Management Editor.
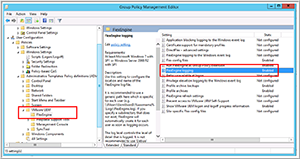
In the left pane of the Group Policy Management Editor, I navigated to User Configuration | Policies | Administrative Templates | VMware UEM | FlexEngine. In the right pane, I double-clicked FlexEngine logging (Figure 3).
 [Click on image for larger view.]
Figure 3. FlexEngine logging in the Group Policy Management Editor.
[Click on image for larger view.]
Figure 3. FlexEngine logging in the Group Policy Management Editor.
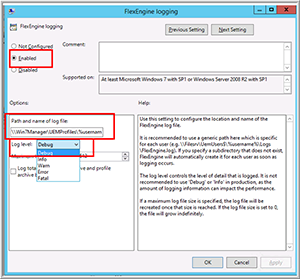
In the FlexEngine logging window, you can select the log level from the dropdown menu and specify the location of the log files (Figure 4).
 [Click on image for larger view.]
Figure 4. Changing the Log level of FlexEngine logging.
[Click on image for larger view.]
Figure 4. Changing the Log level of FlexEngine logging.
After changing the UEM logging level to Debug and performing some UEM activities, I examined the UEM logs again and saw that Debug level logging was being captured (Figure 5).
 [Click on image for larger view.]
Figure 5. The DEBUG error in the FlexEngine log files.
[Click on image for larger view.]
Figure 5. The DEBUG error in the FlexEngine log files.
Change the Debug Level for a Single User
If you only need to change the Debug level for a single user, you can create a FlexDebug.txt file in the same folder as the standard log file for the UEM user. This will trigger FlexEngine to switch to Debug logging only for that user.
Wrapping Up
Once I figured out how to change the log levels in UEM, the process was straightforward and made sense because it was the same place that I originally configured them. Hopefully you won't need to change your Debug level, but if you do, it's good to know that there is an easy way.
About the Author
Tom Fenton has a wealth of hands-on IT experience gained over the past 30 years in a variety of technologies, with the past 20 years focusing on virtualization and storage. He previously worked as a Technical Marketing Manager for ControlUp. He also previously worked at VMware in Staff and Senior level positions. He has also worked as a Senior Validation Engineer with The Taneja Group, where he headed the Validation Service Lab and was instrumental in starting up its vSphere Virtual Volumes practice. He's on X @vDoppler.