How-To
Historical Data in ControlUp
Tom Fenton shows how he configured his system to save historical performance data retrieved from ControlUp, and subsequently used that data to solve a specific issue he was having with one of his virtual machines.
I recently wrote a series of articles on how I used ControlUp to monitor and manage my vSphere environment (located here). ControlUp states, both on their website and in their documentation, that you can use the platform to view historical performance data. I had some initial issues when I tested this feature, which I discovered were due to user error. On further investigation, I was able to configure my system to save historical performance data retrieved from ControlUp. In this article I'll describe that process, including how I subsequently used that data to solve a specific issue I was having with one of my virtual machines.
Saving and Viewing Historical Data using ControlUp
ControlUp's documentation states that ControlUp Insights is a “web-based operational intelligence solution for monitoring and analysis of end-user computing environments. ControlUp Insights displays historical reports regarding activity and resource consumption in enterprise information systems, allowing for efficient troubleshooting of system issues, identifying trends, investigating past activity, and receiving other actionable information.”
After using the product for a few days, however, I still wasn't seeing any historical data and I couldn't quite figure out why.
I followed instructions in ControlUp's documentation to access ControlUp Insights by clicking ControlUp Insights (Figure 1) on the Home ribbon of the ControlUp Management Console (CMC) (the CMC can also be accessed by going to https://insights.controlup.com).
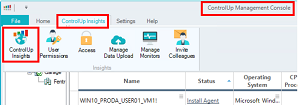 [Click on image for larger view.] Figure 1: ControlUp Insights button
When I clicked the button, however, my web browser popped up and I got a message indicating that I didn't have the permissions to access this site (
Figure 2).
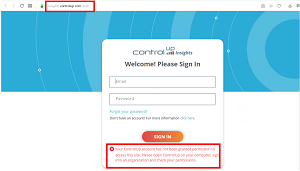 [Click on image for larger view.] Figure 2: Access denied
I went back to the CMC, clicked ControlUp Insights > User Permissions, selected the Permitted to use ControlUp Insights check box (Figure 3), and then clicked OK.
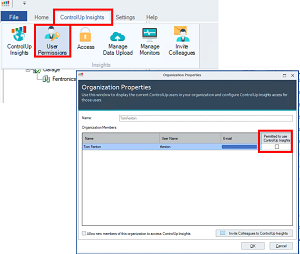 [Click on image for larger view.] Figure 3: Permitted to use
After doing this, and clicking ControlUp Insights, a web page was displayed on my browser which indicated that I had to install the ControlUp Monitor before I could use Insights (Figure 4).
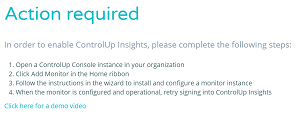 [Click on image for larger view.] Figure 4: Action required
The ControlUp Monitor is a Windows background service that continually collects performance data from your environment and sends it to ControlUp for storage and analyzing. As the Monitor is a service, it does not have a GUI interface like the CMC. ControlUp does not recommended running it on the same Windows system as the CMC; alternatively, they recommend you to run two instances of the Monitor on different Windows systems if you want an active/passive HA solution to collect data.
I found a diagram of the ControlUp architecture that helped me visualize what was going on behind the scene (Figure 5).
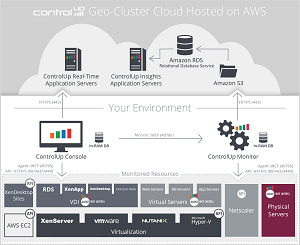 [Click on image for larger view.] Figure 5: ControlUp Architecture
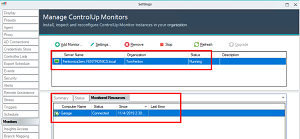
From the CMC, I clicked Add Monitor and a wizard walked me through installing it on a Windows Server in my environment. The installation took place remotely, and I did not need to log in to the Windows system on which I had installed the Monitor (Figure 6), except to open up the firewall for the Monitor service. The entire installation process took less than 2 minutes.
 [Click on image for larger view.] Figure 6: ControlUp Monitor running
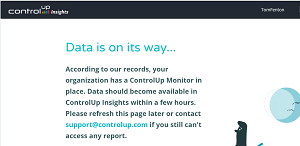
When I clicked ControlUp Insights, I saw a message indicating that the monitor was in place, data was being collected, and I would be able to view the data in a few hours (Figure 7).
 [Click on image for larger view.] Figure 7: Data being collected
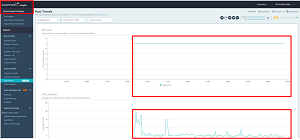
I let Monitor collect data overnight and then checked Insight again the next day; this time, I saw metrics for the period of time that Monitor was running (Figure 8).
 [Click on image for larger view.] Figure 8: Monitor metrics
I let the Monitor collect data for a few days, and then went to the ControlUp Insights Dashboard (https://insights.controlup.com/home/dashboard) from a web browser on my home system (rather than from the system on which the CMC was installed), and started to examine the data. As I was monitoring my home system, nothing really exciting was going on, but I could see the overall utilization of my systems. Moreover, if I clicked on a point of the graph, it would show me other information, including a list of the VMs that were the top consumers of the resource (Figure 9).
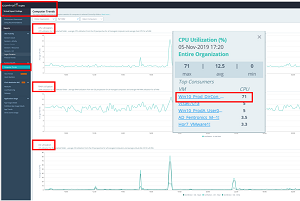 [Click on image for larger view.] Figure 9: Insight historical data
When I clicked the highest consuming VM, it then brought me to the Computer Trends pane that displayed metrics by computers rather than by hosts (Figure 10).
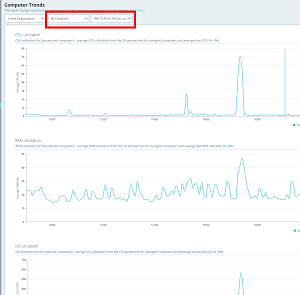 [Click on image for larger view.] Figure 10: Computer Trends
I also found that I could specify a time range by going to the right corner and setting the day and time range I wanted to see (Figure 11).
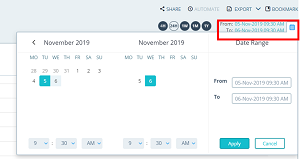 [Click on image for larger view.] Figure 11: Date / time range
Troubleshooting workflow
After using ControlUp for a week or so, I am just beginning to get a sense for how deep it goes and the power behind it. The fact that you can use it to monitor your system in real-time and examine the historical data makes it a powerful troubleshooting tool. To demonstrate the usefulness of this ability, let me take you through a problem I was having and how I used ControlUp Insights and the CMC to solve it.
CPU, RAMs, storage, and networking are all scarce resources on systems, and making sure that they are used correctly and efficiently is one of a systems administrator's top duties. When I started out in IT, a system administrator was responsible for just a few machines (maybe a dozen at the most), but over the years, the system-to-administrator-to-server ratio has been increasing to the point where hyperscale makes it possible for one admin to manage thousands of systems at a time. With this increased workload in mind, system administrators need to work smarter and use all the tools available to them. Even though the troubleshooting example below is from a small environment, the same methodology could be used in larger environments as well.
Identifying that you have a problem
The first step is realizing that you have a problem. Virtual desktop infrastructure (VDI) is the toughest environment to monitor and manage as it has the highest user involvement. In order to allow users to be productive, we need to allow them a certain amount of flexibility with their desktops. However, this flexibility in turn can also cause us the greatest issues, and if we monitor the system only from a macro perspective it may be difficult to spot a particular issue. ControlUp Insights allows administrators instead to zoom in and identify these issues that might have otherwise been missed.
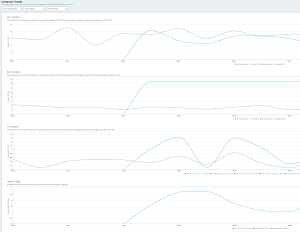
In the example below, ControlUp Insights shows us that we had a blip in network utilization at a given point in time; by clicking on a point on the graph, we can then identify the system that was a top consumer of the network during that time (Figure 12).
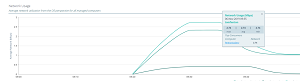 [Click on image for larger view.] Figure 12: Networking
Moreover, by clicking on the system within this popup box, we can focus in on just that system and see that it had a sudden spike in overall resource utilization (Figure 13).
 [Click on image for larger view.] Figure 13: Focusing in on system
By going back to the CMC and focusing in on the system, I saw in real-time that its bandwidth utilization was still quite high (Error: Reference source not found).
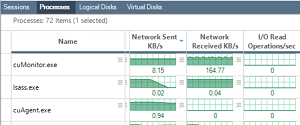
I clicked Process and sorted by Network Sent, which made apparent that the process uTorrent on this system was taking up the network bandwidth (Figure 14).
 [Click on image for larger view.] Figure 14: Process usage
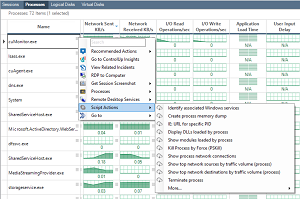
I could have run a script action on the process (Figure 15) to further investigate, but the name of this process (cuMonitor.exe) was a clear indicator of what its purpose was.
 [Click on image for larger view.] Figure 15: Deep dive on processes
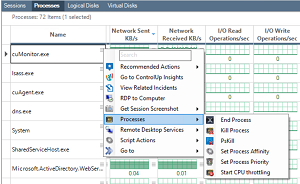
Because running bit torrents in our environment is banned, I killed the process from the Processes menu in the CMC (Figure 16).
 [Click on image for larger view.] Figure 16: Killing a process from the CMC
I then used the Processes menu to send a message to the desktop informing them of the policy (Figure 17).
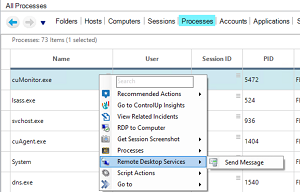 [Click on image for larger view.] Figure 17: Send message from the CMC
To be proactive and to help my environment become self-administrating, I could have used ControlUp to create a trigger-based script action that would automatically monitor the process on the systems and to kill any identified uTorrent process running on any of the systems.
Conclusion
In this article, I showed you how to set up ControlUp to collect historical data, view historical data using ControlUp Insight, and then use that data to spot an issue that one of my systems was having. I then identified the process on the system that was causing the issue, killed the process, and alerted the user on the system what I had done and reminded them of the company policy; I did all these actions from the CMC -- I didn't even have to login to the system. Lastly, I set up ControlUp to monitor the system and automatically prevent this specific issue from happening again.
ControlUp made troubleshooting and remediating this issue quick and easy. To troubleshoot this same issue by using my existing tool set would have been difficult and time-consuming, and the chances of me even identifying that I had a problem to begin with would have been extremely unlikely.
(Note: Tom Fenton is a technical marketing manager at ControlUp.)