How-To
Assessing Your vSphere Environment Using ControlUp
Tom Fenton shows how to install and use ControlUp, which allows you to troubleshoot and then apply corrective actions to issues that you are having in your vSphere environment.
Introduction
Recently I've been having issues monitoring and managing the vSphere environment in my lab. I consulted with a system engineer on my issues, and he suggested that I try ControlUp, a monitoring, troubleshooting, and analytics program. I've been using ControlUp for a few weeks and I'm impressed with the program and find it extremely useful. In this article, I will show you how I installed ControlUp, and discuss ways in which you can use it.
ControlUp has been around for over 8 years now, and over the years has built up a large user base. It originally started out as a program designed to monitor Citrix desktops, and later morphed into a program capable of monitoring physical machines and still later added monitoring of VMware vSphere environments. Now, ControlUp is pushing into the sphere of monitoring VMware Horizon desktops.
But before moving on, however, I do need to backtrack a bit. I mentioned that ControlUp monitors these systems, but it does more than that; the ControlUp console allows you to troubleshoot and then apply corrective actions to issues that you are having in your environment. You can even configure ControlUp to monitor your system and then autonomously apply corrective actions to it.
Installing ControlUp
ControlUp comes with a 3-week trial license, so I could try it out and make sure that it added value before deciding if I wanted to buy it or not. If you are a vExpert or a recognized VMware View Consultant, ControlUp has an Expert Program that you can take advantage of for your home lab.
The majority of ControlUp's work takes place in the ControlUp Management Console (CMC) which runs locally on a Windows system. The CMC does have a few requirements: Net Framework 3.5 SP1, an internet connection, and a system registered to your Active Directory domain. ControlUp Insights is a Software-as-a-Service (SaaS) component that allows you to look at and analyze historical data.
To install ControlUp, I went to www.ControlUp.com and downloaded the product (it was a 120MB zip file), and after doing so, I extracted and started the ControlUpConsole.exe file. When it first came up, I was asked for my name and work email address, and I was then presented with a wizard to create an organization.
An organization represents groups of objects (Host, VMs, servers etc.) managed by the same administrators. Although you can create additional organizations to segment your computers into different administrative units managed by different administrators, I just created a single organization.
The CMC is dived into different sections. I will cover these sections as needed in this article but I wanted to start by identifying the names of the different sections in the following screenshot (Figure 1).
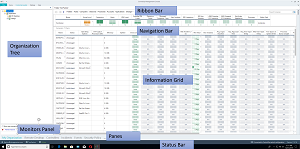 [Click on image for larger view.] Figure 1: ControlUp CMC
Once the CMC came up, I clicked the Add Hypervisor icon and added my vCenter Server (ControlUp supports VMware, XenServer, Hyper-V, and Nutanix AHV hypervisors). Once my vCenter Server was added, my clusters, hosts, and virtual machine's (VM's) inventory were displayed (Figure 2).
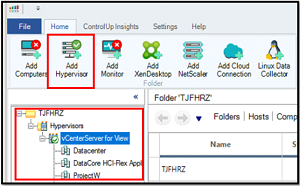 [Click on image for larger view.] Figure 2: Adding Hypervisor
The top of the main pane has tabs for the various objects that can be monitored. I selected one of my clusters (ProjectW), clicked the Computers tab, and was shown all the VMs that were running on that cluster. This tab displayed over two dozen metrics concerning the health of the VMs (Figure 3), which can all be rearranged and sorted. I could also see the metrics for my ESXi server by clicking on the Host tab.
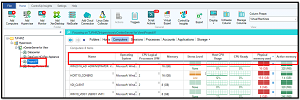 [Click on image for larger view.] Figure 3: Computer metrics
I double-clicked on a VM, and focused in on that VM, and the CMC showed me more information about the VM, including the virtual disks and the metrics for the virtual disks attached to the VM (Figure 4).
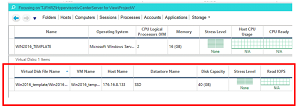 [Click on image for larger view.] Figure 4: VM metrics
I then clicked the three vertical dots in the stress level cell of one of my VMs, and a pop-up window showed me the load and settings for the stress level of that VM. The Stress Level column is a configurable health measurement that is calculated as a sum of the weights assigned to the different metrics that are being monitored. For example, the CPU column might add 2 points to the Stress Level when it crosses the 70 percent threshold, while the Disk Queue column might add 3 points after crossing a threshold of 2. In my case, the Dropped Received Packets metric was displaying a load of 1 so the stress level was low (Figure 5).
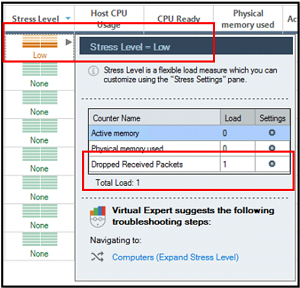 [Click on image for larger view.] Figure 5: Stress level
I was curious as to what the parameters for Dropped Received Packets were, so I clicked the Stress icon on the ribbon bar, which brought up the Stress Level Settings pane. The first thing that I noticed was that the settings were inherited and not unique to this VM. I then clicked Dropped Received Packets and noticed that the yellow counter would be set off if it had 1 dropped packet, and the load would be set to 1. A red counter would be set off if it had 10 dropped packets, and the load would be set to 2. If you want to change these settings, however, you can do so by clicking the Inherit default settings check-box (Figure 6).
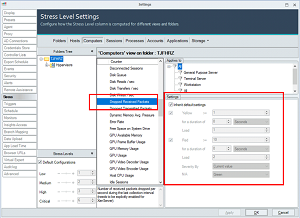 [Click on image for larger view.] Figure 6: Stress level settings
I then clicked on the Storage tab, which brought up all of the datastores that my vCenter server knew about and their metrics. The storage metrics included a Stress Level column, and you are able to sort the columns (Figure 7).
 [Click on image for larger view.] Figure 7: Storage
Wrapping Up
Overall, I was impressed with ControlUp for how easy it was to install and how well it did when monitoring the hosts, VMs and storage in my vSphere environment. In my next article on ControlUp, I will take a closer look at how it can be used to monitor the processes running on VMs.
Update: See Part 2 here and Part 3 here.
(Note: Tom Fenton is a technical marketing manager at ControlUp.)
About the Author
Tom Fenton has a wealth of hands-on IT experience gained over the past 30 years in a variety of technologies, with the past 20 years focusing on virtualization and storage. He previously worked as a Technical Marketing Manager for ControlUp. He also previously worked at VMware in Staff and Senior level positions. He has also worked as a Senior Validation Engineer with The Taneja Group, where he headed the Validation Service Lab and was instrumental in starting up its vSphere Virtual Volumes practice. He's on X @vDoppler.