How-To
Azure Monitor 101
Paul Schnackenburg looks at the tool for monitoring all your Azure IaaS and PaaS services, plus your own applications and code, explaining what it can do, how to design and configure it and how to connect your workloads.
Keeping an eye on performance and availability of your cloud resources -- possibly your on-premises VMs and applications, maybe even workloads running in other clouds -- is vital, and in Azure this is the job of Azure Monitor. In this article we'll look at what it can do, how to design and configure it and how to connect your workloads.
In true Microsoft fashion, this service goes by a few names such as Log Analytics and Operations Management Suite (OMS), so we'll also sort out how these names/technologies fit together.
A Little History
Large businesses tend to have extensive on-premises infrastructure, and monitoring virtual and physical servers, networking gear, applications and security signals is a must.
System Center Operations Manager (SCOM) has been around for decades, but it comes with a fair bit of infrastructure, configuration, tuning and maintenance. Once up and running and adapted to your environment, SCOM delivers the goods. There are Management Packs (MPs) for every Microsoft OS and application under the sun, as well as for all popular Unix flavors. These MPs are built by product experts and bring monitoring rules and alerts with remediation suggestions. So if you're running Exchange Server, there's an MP, written by the products group, with alerts when a particular metric exceeds X value, along with suggested steps for remediation. Beyond Microsoft's MPs there's a large third-party ecosystem of MPs so if you have Dell or Lenovo servers for example, you can add an MP to SCOM that'll let you know when a fan in a power supply is about to break because of changes in its spin. Microsoft provides a guide for migrating from SCOM to Monitor; just be aware that they're not the same kind of product so it's not a straightforward "upgrade."
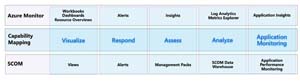 [Click on image for larger view.] Comparing Azure Monitor with Operations Manager(source: Microsoft).
Fast-forward in our history lesson and in 2015 Microsoft releases OMS, Operations Management Suite, as a Software-as-a-Service (SaaS) alternative to SCOM, removing the burden of managing your own infrastructure to run your monitoring. It had Solutions for monitoring Active Directory replication for instance, along with more than 20 other ones (a far cry from the hundreds of MPs available for SCOM). OMS as a brand no longer exists, but the name crop ups in blog posts, documentation and agent configuration names. There are still Solutions from Microsoft and third parties but the Microsoft ones aren't actively maintained. Its replacement is Azure Monitor, which offers a slightly different take on monitoring.
Azure Monitor
Designed to be the single place for monitoring all your Azure Infrastructure-as-a-Service (IaaS) and Platform-as-a-Service (PaaS) services, plus your own applications and code while also being able to extend to on-premises resources as well as resources in other clouds, Azure Monitor is built on top of Log Analytics, the platform service that gathers log and metrics data from all your resources. Think about it like this -- Azure Monitor is the marketing name, while Log Analytics is the technology that powers it. Trying to clarify this for customers, Microsoft has started to refer to Log Analytics as Azure Monitor Logs instead.
Some basic concepts in Azure Monitor are workspaces, each of which lives in one region in Azure. They're administrative boundaries. Each workspace has a daily data ingestion cap, a specific charge plan and retention settings (you can have different retention for different data in the same workspace). The recommendation is having as few workspaces as possible (1-3) but there are some reasons to split data such as regulations governing data sovereignty, autonomy of IT teams in different parts of the world or latency concerns.
To govern access to different data, you use Role Based Access Control (RBAC) to manage access to each workspace. Unique in Azure, there's a feature in Log Analytics where you base access to telemetry from a workload based on if the user has access to the workload itself. In other words, if you have access to manage six VMs and two databases, you'll automatically have access to their telemetry but no others. This is turned on by default for new workspaces created after March 2019 and you can turn it on for older workspaces under Properties -- Access control mode; "Use resource or workspace permissions" followed by removing general workspace access permissions.
There are two types of data categories in Azure Monitor: metrics, a count of a particular value with little additional data attached, such as "packets per second" or "disk queue length"; and logs, which carry detailed information. With any monitoring system there's latency between the event taking place and the data showing up in the dashboard. This is higher for cloud-based services (if the workloads are on-premises or in other clouds) but it's lower for metrics than it is for logs.
This means you should use metric alerts to let you know that something is wrong, while logs will find out what's wrong.
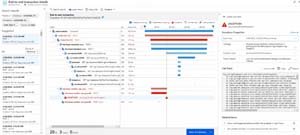
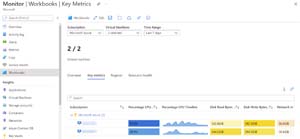 [Click on image for larger view.]Monitor Workbook VMs Key Metrics
Think of Azure Monitor as a big bucket of data, spread across various tables. Just like a database, you use a query language to find the information you need. Here you use Kusto Query Language (KQL) instead of SQL (they're similar but KQL is optimized for searching large amounts of structured and semi-structured data), both for ad-hoc queries and to build alerts. These alerts can take the form of text messages, emails, push notifications in the free Azure App for Android and iOS, integration with your IT services platform, or if you really want -- a phone call. When you set up alerts you build Action groups to define one or more notification channels. These can also include Azure Functions, Logic Apps, Azure Automation Runbooks or connecting to a webhook endpoint. If you end up with multiple workspaces, you can run queries (provided you have permissions) across multiple workspaces in one query.
If this sounds like a lot of work, know that there's a long list of ready-made queries called Insights, in-box visualization and workbooks for deeper investigations and in-built dashboards.
Deploying Azure Monitor
Unless you have only a few workloads, you need to ask some questions upfront to ensure a successful deployment. Start with a strategy that should include a list of workloads, which ones we need to monitor and which ones of those are business critical, and if there are any SLAs we need to keep for remediation. The strategy should also include your overall design as to number of workspaces, which regions, access requirements for different staff and how you're going to connect workloads at scale, which can be done through Azure Arc, Azure Policy or ARM templates. You'll also want to have a plan for automation, remediations and ongoing optimization.
If this is a really large rollout (1TB+ per day) you can pick Dedicated Clusters, this also provides Customer-managed keys and Double encryption, giving you full control over stored data and Lockbox when Azure support engineers need to access your cluster. Dedicated clusters can also be helpful if you have Multi-workspaces for performance reasons.
While Azure Monitor scales elastically like any good cloud service, if you're planning to ingest more than a few TB per day, it's a good idea to contact Microsoft to make sure there's capacity available.
Billing is based on which plan you've picked, how much data you are storing and how long you're retaining it for. Look into Capacity Reservation plans and Daily Caps to manage your spend.
Azure Monitor works with Private Link to make sure your telemetry network traffic only traverses Azure's backbone network, if you're monitoring on-premises workloads you can use Site to Site VPN or ExpressRoute to route that traffic securely as well.
Modern cloud deployments are a mix of IaaS VMs and PaaS technologies that you'll need to include in your plan. If you're going to monitor non-Azure VMs, there's the current Log Analytics agent (Windows) and the Telegraf agent (Linux), both of which are going to be replaced by the newer Azure Monitor agent, which is in preview at the time of writing.
To manage what data comes from each workload use Data Collection Rules, which is available for VMs today with other workloads coming.
Insights
Today there are 11 Insights available, a bit like MPs in SCOM covering Virtual Machines, Containers, Networks, Storage accounts, Backup, Cosmos DB, Cache for Redis, Data Explorer Clusters, Key Vaults, Applications and Windows Virtual Desktop.
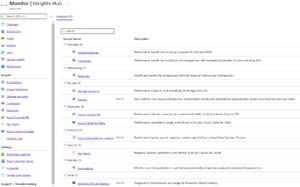 [Click on image for larger view.]Insights Hub in Azure Monitor
Network Monitoring
Any monitoring solution must offer network monitoring to check on connectivity, errors and data throughput.
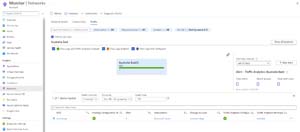 [Click on image for larger view.]Network Monitoring
Azure Monitor is on the second version of its network monitoring, which covers all networking parts (no agent required for Azure cloud monitoring) such as subnets and vNets, VPN and performance, ExpressRoute, plus Traffic view and Diagnostics tools for troubleshooting. The diagnostics button lets you enable packet capture for VMs along with troubleshooting connectivity issues, troubleshooting VPNs and identifying next hops as well as diagnosing traffic filtering issues.
If you're using DNS servers you can monitor them. Azure Monitor can also keep an eye on Application Gateway, a PaaS service for protecting your web apps, and also offers Network Performance Monitoring.
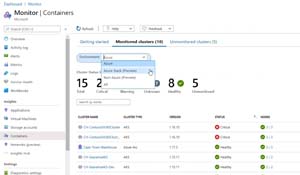
Monitoring your Containers
Azure Monitor for containers follows the strong focus Azure has on Kubernetes (along with every other IT vendor on the planet) and can monitor clusters in Azure Kubernetes Services (AKS), self-hosted Kubernetes clusters in Azure using AKS Engine, Azure Container Instance (ACI), Azure Red Hat OpenShift and Azure Arc enabled Kubernetes.
 [Click on image for larger view.]Azure Monitor Container Monitoring source: Microsoft
The Kubernetes Insight displays containers running on each node, average CPU and memory usage for AKS, and for ACI it tracks processor and memory utilization for container groups and containers. This gives insight into the behavior of your clusters under both average and heavy loads, which helps with capacity planning. Set up alerts for CPU and memory usage thresholds as well as health state changes. It integrates with Prometheus and Kube state and Network Policy Manager metrics are gathered. It comes (like several other Insights) with recommended metric alerts to help you get started.
Virtual Machines
The aforementioned Virtual Machine Insights covers both VMs and VM Scale Sets (VMSS, groups of VMs that scale up and down based on load) plus gives you a VM map so you can see how VM workloads are connected.
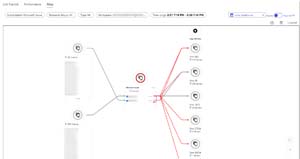 [Click on image for larger view.]VM Insights Connectivity Map
If you have lots of VMs you probably want to find the top problems ones, use the "top N charts" to do this, grouping by available memory, CPU usage, disk space and bytes sent/received.
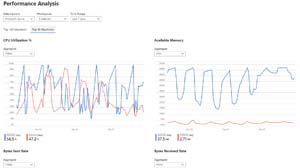 [Click on image for larger view.]Monitor Workbook VMs Performance Analysis
Application Insights
App Insights is another of the 11 Insights and is Microsoft's Application Performance Management (APM) solution to keep an eye on your in-house applications. A new feature is the ability to integrate the APM monitoring in the same workspace where you look at the platform and infrastructure, making it easier to track down problems across the whole stack.
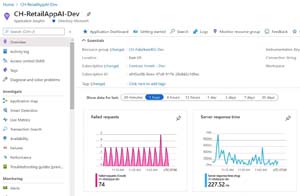 [Click on image for larger view.]Azure Monitor Application Insights Dashboard source: Microsoft
App Insights supports .NET, Java, Python, Node.js, iOS, Android and React programs across on-premises, hybrid and any public cloud, either through an instrumentation package in your application or by deploying the Application Insights Agent in your Azure VMs and VMSS, Azure App Services, Azure Functions or Azure Cloud Services.
The data gathered includes request rates, response times, failure rates and the same data for external dependencies (APIs), plus exceptions, page views and load performance, AJAX calls, performance counters (both Windows and Linux), user and session counts, host diagnostics from Docker or Azure, as well as diagnostics trace logs from you app. If you're troubleshooting a current issue, use the Live Metrics Stream to see data with roughly one second latency as you're applying fixes or finding the line of code that's causing the issue.
 [Click on image for larger view.]Azure Monitor Application Insights Transaction View source: Microsoft
Monitoring large applications is challenging, so you can use Smart Detection, based on Machine Learning (ML), which identifies performance and failures in your programs without you creating custom rules.
Beyond identifying problems, App Insights also gives you information about your application's usage. Data is tracked as to when people are using the app, popular pages, the OS and browser they're using and where they're located. Retention gives insight into which users return to your app, while Funnels tracks your users as they progress through multistage experiences in your app to see where they drop off. The User Flows visualization tool shows how users progress from page to page. Group users, events, operations or sessions into Cohorts to follow a specific set of users or events repeatedly. If you're trying to determine if different page load times affect usage, use Impact. App Insights also helps you with A/B testing to identify which version is most popular, performant or impactful.
This information can been seen in the new Application Insights Overview dashboard, while the graph of different parts of your distributed application is shown in Application Map.
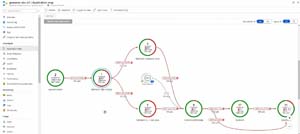 [Click on image for larger view.]Azure Monitor Application Insights Map source: Microsoft
Other Resources in Azure
Azure Key Vault stores secrets (passwords, connection strings, certificates and other sensitive information) which can be held either in software or by a Hardware Security Module (HSM). Up to 200 Key Vaults can be monitored, showing you all requests, performance, failures and latency.
Azure Cache for Redis can also be monitored tracking metrics such as used memory, CPU, number of connected clients and errors as well as cache read/write/hits and misses.
Cosmos DB is also covered with monitoring for performance, failures, capacity and operational health.
Monitoring Windows Virtual Desktop (in preview at the time of writing) is possible but there's a bit of work in setting it up. It looks at your hosts in your host pools for both performance telemetry and event log data.
Both SAP on Azure VMs and SAP on Azure Large Instances are supported (in preview), covering both the SAP HANA database and SQL Server. It's open source and, as are all the other Insights, available at no extra cost.
Automation Workflows and Alerts
Generally you'll proceed with your plan, set up workspace(s), connect workloads through agents or enable PaaS services for Azure Monitor, configure the required Insights and Solutions. Once that's done, you need to set up automation workflows and alerts.
Alerts can be configured to notify you in many different ways (see above), but the Logic Apps and Power Automate Actions provide a lot of flexibility. Alerts can be based on either Metrics or Log data but can also alert based on actions taken in the Azure control plane on your Azure resources (resizing a database for instance) through Activity logs. If the built-in tools aren't enough, considering third-party integrations.
A well-tuned monitoring system uses automation, not only to alert you when something is amiss but also to help you remediate common problems.
Recent features include being able to set up Alert rules on Custom Metrics even before they've started being collected. You can now combine multiple and conditions in a single alert rule. And there's my favorite: the ability to create an alert from a KQL query. The Linux agent can be multi-homed, sending telemetry to different workspaces. Making sure you only get what you need from the quite verbose Windows event logs can now be done with XPATH queries.
Both Workbooks and Dashboards for visualization have been mentioned, but if you need even more powerful options you can send data to Power BI or Grafana.
For large environments where security and auditing are crucial, there's now Log Analytics Query Auditing, which shows when a query was run, who ran it, using what tool, the query code itself plus performance statistics.
Azure Arc
As mentioned, Monitor can manage workloads outside of Azure, such as on-premises, and VMs running in other clouds. For servers this has been available prior to Azure Arc and involves deploying the agent to a Windows/Linux VM or physical server and pointing it to the workspace. Azure Arc is hybrid on steroids, extending much farther than Azure Monitor. Azure Arc-enabled servers (generally available) brings a representation of them into the Azure portal and lets you manage them with Azure Policy and also monitor them using Azure Monitor. At the time of writing Azure Arc enabled Kubernetes and Azure Arc-enabled SQL servers are in preview.
Azure Monitor also supports Azure Lighthouse so that Managed Service Providers (MSPs) can offer monitoring as a service, once they've been provided delegated access.
Conclusion
Azure Sentinel builds on top of Azure Log Analytics workspaces, proving the scalability and flexibility of that service, not just for monitoring workloads but also for ingesting large amounts of security telemetry.
Azure Monitor is not SCOM, the level of detail and work involved in setting it up is different and it's designed for a cloud environment, not on-premises IT. If SCOM or a third-party monitoring solution is already in place for your on-premises infrastructure, Azure Monitor isn't going to replace it, but when it comes to keeping an eye on your cloud infrastructure, it's the best solution.
Azure Monitor is a focus area with many new features coming out regularly. If you're deploying resources to Azure, monitoring is essential so make sure you train your IT staff.
And, as industry expert Howard M. Cohen advised in a recent webcast, "Whatever You Spend on Monitoring Is Worth It."