How-To
Azure Sentinel in the Real World
Smaller organizations need the same IT security services as larger businesses but without the corresponding price tag, says Paul Schnackenburg, so he decided to "build a SIEM for SMBs" on a shoestring budget.
Back in mid-2019 we looked at Azure Sentinel (then recently released), Microsoft's cloud-based Security Information and Event Management (SIEM). In this article I'll guide you through a real-world Sentinel deployment for one of my clients, lessons learned and some thoughts around SMB cybersecurity in general.
Stuck in the Middle
My business has been providing IT services to SMBs since 1998 so I know the challenges and limitations of the "smaller end of town" intimately. The move to cloud is completed for most of my clients, with some still in a hybrid world with a few workloads on-premises.
Just like larger businesses, SMBs feel the pressure of shrinking IT budgets, the challenge of the Covid pandemic and, most of all -- the changing cybersecurity landscape. But there's no way that they are going to be able to afford a full-blown Managed Detection and Response (MDR) solution, backed by a 24/7/365 Security Operations Center (SOC).
So, I do what I can -- I deploy centrally managed antimalware on each endpoint, I ensure they have a business class firewall for their offices, I provide security awareness training and simulated phishing campaigns and I configure their cloud services according to best practices. I also make sure they have solid backups, with copies stored off site. But my concern is the same as many larger organizations, the lack of visibility -- if (when) they're compromised we won't know about it until it's too late. It's the same dilemma as always: SMBs need the same IT services as larger businesses but without the corresponding price tag.
When I saw that Sentinel provided several free data sources (Azure activity, Office 365 audit logs and alerts from the Microsoft 365 Defender suite) as long as I don't retain it for longer than 90 days and that Sentinel has connectors for nearly every data source, I decided to see if I could "build a SIEM for SMBs" on a shoestring budget.
The client I started with is an independent school with approximately 90 students, from year 1 to year 12, plus about 20 staff. They have Microsoft 365 A3 (equivalent to E3 in the commercial world) deployed to all staff and students and two on-premises Dell Hyper-V hosts running Windows Server 2019 with a total of seven VMs. The newer server runs all VMs, and the older server is in a separate building as a Hyper-V replica target for DR. The VMs are two DCs, a file/print server, a LOB app, Windows Server Update Services (WSUS), Microsoft's Advanced Threat Analytics (ATA) and a Linux syslog server (more on that last one later).
Connecting Data Sources
I set up an Azure account for the client, based on the same Azure Active Directory as their Microsoft 365 tenant, and deployed a Log Analytics workspace with Azure Sentinel on top of it in the Australia East region (I always use https://www.azurespeed.com/ to make sure I host resources in the closest region whenever possible). I set the retention to 90 days (as that's free), but I know that many security professionals will probably choke on their morning coffee reading that because it severely limits the ability to find intruders with long dwell times -- many organizations (and regulatory frameworks) require several years of retention. But the aim here is to fit within a small budget and provide visibility to catch the bad guys early, so 90 days it is.
Next, I configure Data connectors (there are 116 to pick from at the time of writing with more being added each week) -- Azure AD, DNS, Office 365, Security Events, Threat intelligence -- TAXII and Windows Firewall.
Two of those are simple cloud connectors, just provide Global Administrator (or Security Administrator) credentials and pick what to ingest, here's the configuration for AAD:
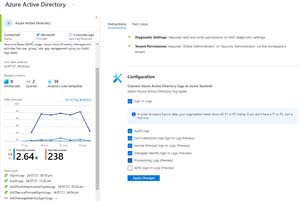 [Click on image for larger view.] Azure AD Connector
Most connectors come with workbooks for visualization; here's a workbook for Office 365:
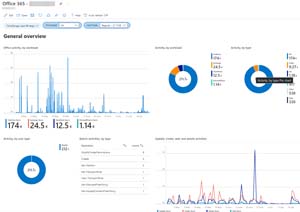 [Click on image for larger view.] Office 365 Activity Workbook
These give you a way to visualize and dig into normal activity by your users, in this case what they do across OneDrive, Exchange, SharePoint and Teams.
The DNS, Security events and Windows Firewall connectors rely on log data from the on-premises VMs and hosts. On each of them I installed the Microsoft Monitoring Agent (MMA) and configured them with the workspace ID and primary key from the Log Analytics workspace. This is a simple install If you have servers that don't have internet connectivity, you can use the Log Analytics gateway to proxy the uploads, but that's not an issue at this client. If I was going to do this again, I would instead opt for the newer Azure Monitoring Agent (AMA) as it's the future log collecting agent across both Windows and Linux. One benefit of AMA are data collection rules that let you filter to collect only specific log entries using XPath queries, but fortunately the Security events connector with MMA lets you filter on Minimal or Common (or all) events. I picked Common.
Again, in an ideal world I would deploy the agent on all client endpoints as well for full visibility of all security events across all nodes (which I'll do at my next client who only has 10 client devices and a NAS file server), but at this client I'll need to watch the ingestion cost carefully before expanding log collection.
The last data connector is Threat intelligence -- TAXII, which is one way to ingest TI data into Sentinel. Based on this blog post I connected to Anomali's free intel feed to get data on new ransomware domains/IPs, malware domains, TOR nodes, C2 servers and compromised hosts.
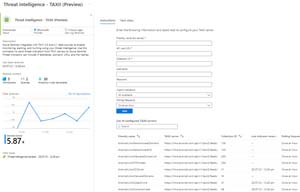 [Click on image for larger view.] Threat Intelligence Feed
Rules, Log Queries and Workbooks
Once the data is in Sentinel it's time to mine it for suspicious activity. Sentinel comes with hundreds of built-in analytics rules templates -- I looked through the list (filtering on High and Medium severity) to start with and enabled all of them that relied on the data connectors we have.
Here's an example of one such rule -- Rare RDP Connections -- which identifies when a new or unusual connection is made to any of our servers (RDP is only available on the internal network).
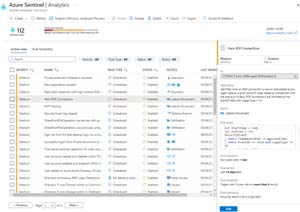 [Click on image for larger view.] Analytics rule - Rare RDP Connection
I've set up most of these rules to run once a day to generate alerts.
When you're trying to understand the data you have you can use Logs to explore the different data sources and tables. Here I'm looking at the data coming back from Windows Firewall on the servers.
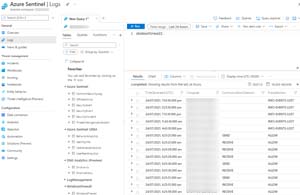 [Click on image for larger view.] Log Query - Windows Firewall
Most connectors come with a set of workbooks, which is another way of visualizing the data. Here's the Insecure Protocols workbook, aggregating legacy protocols in use across AD and AAD in the last seven days.
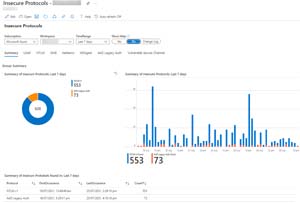 [Click on image for larger view.] Workbook - Insecure Protocols Visualization
Automation
Alerts in the portal are great -- once you see them you can start an investigation to determine if this is really a malicious issue that needs further investigation or a benign false positive. But as mentioned, there's just me and I certainly have better things to do than sitting and staring at a portal UI all day. Each alert rule has the ability to configure an automated response when it's triggered, but I didn't want to have to set up and maintain this for each rule, so I created a single Logic App that catches any alert and emails it to me (and the local IT teacher at the school).
Here's the workflow:
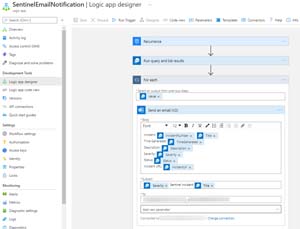 [Click on image for larger view.] Logic App - Send Alert Email
And here's the resulting email alert:
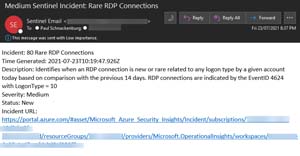 [Click on image for larger view.] Email Alert for Rare RDP Connection
The link in the email lets me go direct to the alert and start an investigation in the UI that shows me each data point involved in the alert, in this case the server that was accessed, the user and the client IP address with the ability see more information about each of them as well as a timeline of activities.
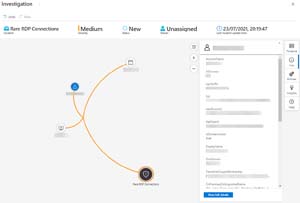 [Click on image for larger view.] Incident Investigation in Sentinel
The Future
This solution has been in production for about two months now, at a monthly cost of under $50 (plus my time in setting it up and investigating incidents). We've had 81 incidents in that time, all of them either false positives or unsuccessful brute force password attacks against AAD.
There are three more data sources that I'm keen to connect. The client's internet connection is protected by a CheckPoint Quantum Spark 1550 appliance that can send log data to a syslog server. Their antimalware solution is ESET, and the central management server "Protect" has a Sentinel connector, again relying on a syslog server. Finally, the client's Microsoft 365 A3 license comes with Microsoft's Advanced Threat Analytics (ATA), (the predecessor to what's now called Microsoft Defender for Identity) which keeps a close eye on the logs and network traffic going into and out of the two DCs. It can also emit logs to a syslog server. I've deployed a Ubuntu Linux 18.04 server VM and the connection configured, but the logs aren't being synchronized to Sentinel -- troubleshooting to follow. When those data sources are in place, however, I'll feel confident that we'll have much better visibility than we used to.
Again, enterprise security architects might find this approach lacking. For example, if I'm not checking email for half a day, we could have an intrusion that I'll only catch after the fact. But again, this fits into what this client can afford, and overall we're in a much better cybersecurity awareness situation than a few months ago.