How-To
Getting Started with the IAM Access Analyzer
AWS Identity and Access Management (IAM) is perhaps the AWS service with the greatest potential to introduce security misconfigurations. After all, an IAM role with excessive permissions can result in security vulnerabilities. A new tool called the IAM Access Analyzer can help you to find IAM resources with unused permissions, IAM settings that allow for external access, and more.
To get started, log into AWS and then open the IAM console. When the IAM Dashboard opens, expand the Access Reports tab and then click on the Analyzer Settings tab. Now, click on the Create Analyzer button.
At this point, AWS will display the Create Analyzer screen, which you can see in Figure 1. As you can see in the figure, you have a choice between External Data Analysis and Unused Access Analysis. As of the time that I wrote this blog post (July 2024), external access was free, but unused access analysis costs $0.20 per user per month. As such, let's take a look at how to set up external data analysis.
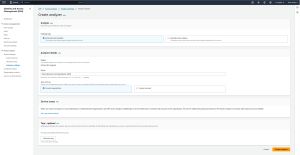 [Click on image for larger view.] Figure 1: Select the External Access Analysis option.
The next thing that you will need to do is to take a look at the Analyzer Details section, shown in the figure above, and make sure that the analyzer is looking at the correct region. You will also need to provide a name for the analyzer. You can use the default name if you like, but it's usually better to provide AWS with a more meaningful name. While you are at it, you will need to verify that the Zone of Trust option is set to the current organization rather than the current account.
When you are done, add tags that you want to assign and then click the Create Analyzer button. It is worth noting that when you create the analyzer, AWS will create a service linked role that will be named AWSServiceRoleForAccessAnalyzer. This role is going to be created for every account within your organization.
Now that you have created the analyzer, you can review its findings by expanding the Access Reports tab and then clicking on External Access. This screen displays any external access analyzers that you might create, along with their findings. It's possible that the findings section might initially appear to be empty. If that happens, then wait for a few minutes and then refresh your browser. The findings should eventually appear, as shown in Figure 2.
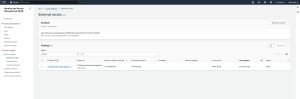 [Click on image for larger view.] Figure 2: The findings are listed on the External Access tab.
Even after your analysis appears within the dashboard, it can still take a while for the results to be compiled. The time that is required for the details to show up can vary from hours to days. In my own environment, which is tiny and only used for lab purposes, it took just over three days for the summary results to be generated.
To view the results, expand the Access Reports tab and then click on Access Analyzer. This will cause the console to display a summary screen, which displays both external access findings and unused access findings. You can see what this screen looks like in Figure 3.
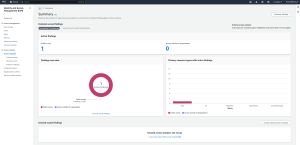 [Click on image for larger view.] Figure 3: This is what the summary screen looks like.
The External Access Findings Dashboard shows three key pieces of information. First, this dashboard displays active findings. Active findings are essentially the number of IAM settings that provide access from outside the organization. The dashboard also displays the number of settings that provide public access to the AWS environment.
The second item that is displayed within the dashboard is the Findings Overview. The Findings Overview consists of a chart detailing the number of public access findings and the number of findings outside of the organization. This chart also displays the total number of active findings.
The third piece of information that is displayed is the resources that are affected by these findings. This chart lists various AWS services (S3, EC2, EFS and so on) and then details the number of public findings and findings outside of the organization for each.
If you choose instead to report on unused access then the summary screen will report the number of unused roles, unused credentials, and unused permissions. Additionally, the summary will present you with a findings overview that lists the total number of active findings. This summary also breaks down findings by type. For example, you can see things like the number of unused passwords, unused access keys, roles with unused permissions, and more.
Additionally, the summary screen provides you with a chart listing the accounts with the most findings for unused access. That way, you can easily determine where to begin focusing your account lockdown efforts. A Finding Status window helps you to keep track of the number of which findings are still active, as opposed to those that have been resolved.
About the Author
Brien Posey is a 22-time Microsoft MVP with decades of IT experience. As a freelance writer, Posey has written thousands of articles and contributed to several dozen books on a wide variety of IT topics. Prior to going freelance, Posey was a CIO for a national chain of hospitals and health care facilities. He has also served as a network administrator for some of the country's largest insurance companies and for the Department of Defense at Fort Knox. In addition to his continued work in IT, Posey has spent the last several years actively training as a commercial scientist-astronaut candidate in preparation to fly on a mission to study polar mesospheric clouds from space. You can follow his spaceflight training on his Web site.