How-To
Using ntopng for Network Visualization and Monitoring
In a previous article, I wrote about/confessed what a mess my home/home lab networking was and discussed various tools I used to discover what devices were connected to my home network and where they were located. But that was just the start of my sorting out my home network, as I also wanted to know what the traffic was doing and precisely what network traffic was ingressing and egressing to the internet from my home local area network (LAN).
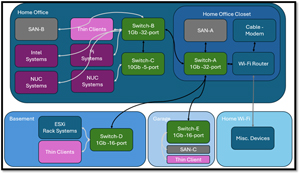
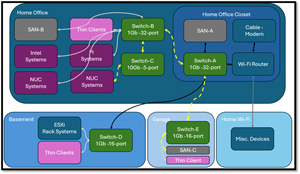
My home LAN is a mismatch of various switches, SANs, and other devices that span multiple rooms of my house. It is embarrassing how I lost control of it.
 [Click on image for larger view.]
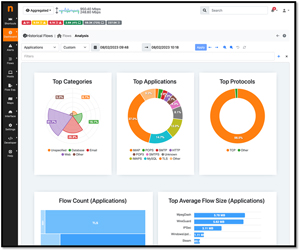
The tool I will be using to monitor and visualize the network traffic going from my LAN to the internet is one of the oldest and most popular network monitoring tools, ntopng. Many still refer to it by its old name, ntop, as the "ng" suffix in ntopng denotes "next generation," reflecting its evolution into a more powerful and user-friendly tool. It is widely used as it is free, open source, and powerful enough to track bandwidth usage, monitor your network's overall health and performance, and identify any bottlenecks affecting networks. It also has a GUI to help you visualize the massive amounts of data it collects. The graphic below shows how this data is displayed.
 [Click on image for larger view.]
Introduction to ntopng
Since the first computers were networked, we have attempted to understand what was happening to them by monitoring the traffic between them. We have developed various tools to do just that. Ntop was one of the first popular tools for this.
Ntop is a portmanteau from network top. It was initially created as a UNIX-based tool in 1998. Since then, it has evolved and become more powerful and morphed into ntopng, but it still remains free, open source, well-loved by system and network administrators, and extremely popular.
Features of ntopng
ntopng is packed with features that cater to the diverse needs of network monitoring. Some of its key features include:
- Real-time Traffic Analysis: It provides real-time visibility into network traffic, allowing administrators to see what is happening on the network at any moment.
- Historical Data: The tool archives data over time, enabling long-term analysis and identification of usage trends.
- Protocol Detection: It automatically detects and categorizes network protocols, giving insights into the types of traffic traversing the network.
- High-speed Network Monitoring: ntopng is built to handle high-speed networks efficiently, making it suitable for modern, high-bandwidth environments.
- Security Monitoring: The tool can detect and alert suspicious activities, providing an added layer of security.
- Customizable Dashboards: Administrators can create custom dashboards tailored to their specific monitoring needs.
- Integration Capabilities: ntopng integrates with various other tools and platforms, enhancing its functionality and ease of use.
Where to Run ntopng
The diagram below shows that I have switches that condense and segregate my network.
 [Click on image for larger view.]
My switches' segregation makes it impractical for me to monitor all the traffic on my LAN. To explain why, I will get a little geeky and do a deep dive into how network switches work and route network traffic.
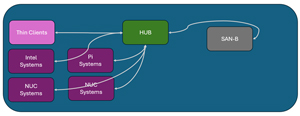
The first thing to understand is that a switch works entirely differently than a network hub (which are no longer widely used). A hub broadcasts data to all devices on it, while a switch directs data packets to their intended destination. This greatly decreases network traffic and enhances network performance and security.
Here is a simple diagram showing how a data packet from SAN-B to a thin client is broadcast to all the devices connected to a hub.
 [Click on image for larger view.]
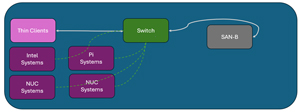
Here is the same diagram only showing how the data packet from SAN-B is only sent to the thin client (white line) even though all the devices are connected (dashed green line) to the switch.
 [Click on image for larger view.]
To accomplish this, a network switch operates at the OSI model's data link layer (Layer 2). It uses MAC (Media Access Control) addresses provided by the NIC to determine where to forward data packets within a local area network (LAN).
The switch maintains a list of the MAC addresses it knows about, which maps MAC addresses to specific ports on the switch. When a switch receives a data packet, it examines the packet's header to read the destination MAC address. It then references its MAC address list to find the corresponding port and forwards the packet ONLY to that port.
It learns the MAC addresses of devices connected to its ports by listening to incoming packets. As packets arrive, the switch notes the source MAC address and the port on which the packet was received. This information is added to the MAC address table, allowing the switch to build a map of the network's devices.
Once the MAC address table is populated, the switch forwards packets only to the appropriate port rather than broadcasting them to all ports like a hub would. If the switch receives a packet with a destination MAC address, not on its table, it broadcasts the packet to all ports except the one it came from. When the destination device responds, the switch learns its MAC address and updates its table. The only exception is broadcast traffic, which is sent to all devices on the network, as it is intended for all devices. Otherwise, regular traffic is only sent to the appropriate destination port.
As my switches are connected to a central switch (Switch-A), the packet propagates until its destination is located. This is shown in the diagram below in dashed yellow lines as a data packet is transmitted from an NUC system in my home office to a SAN system in my garage.
 [Click on image for larger view.]
If hubs were used, it would significantly increase the traffic in my LAN, leading to network collisions and decreasing security as any device on the network could see all the network traffic.
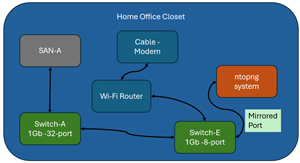
The point of this digression is to explain why I placed my ntopng monitor between my Wi-Fi Router and switch.
 [Click on image for larger view.]
You may wonder how the ntopng system can see network traffic if a switch only passes traffic between the cable modem and Wi-Fi. This is where managed switches and port mirroring come into play.
Managed Switches and Port Mirroring
Unlike unmanaged switches, managed switches have a GUI or command line interface with advanced networking features like port mirroring. Port mirroring allows network administrators to monitor network traffic by copying all data packets received on one or more source ports to a designated "mirror" port. This mirrored traffic can then be analyzed by ntopng.
I bought a new TP-Link TL-SG108E, an 8-port Gigabit Switch with port mirroring, for $30 on Amazon. I will place this between the Wi-Fi router and the cable modem and set it up to mirror the traffic going out of and into and out of the cable modem to the port that ntopng will be running on.
In my first article on trying to get a handle on all the devices connected to my home LAN, I used various tools to discover and locate devices on my home network. But that was just the beginning of this project, as I also wanted to monitor and visualize network traffic coming from and going out to the internet. To do this, I will use ntopng, a free, powerful, open-source network monitoring tool. To intercept this traffic, I will use an inexpensive TP-Link managed switch to mirror traffic to a device running ntopng.
In my following articles, I will discuss what platform I will use to run ntopng on and how I will set it up and use it.
About the Author
Tom Fenton has a wealth of hands-on IT experience gained over the past 30 years in a variety of technologies, with the past 20 years focusing on virtualization and storage. He previously worked as a Technical Marketing Manager for ControlUp. He also previously worked at VMware in Staff and Senior level positions. He has also worked as a Senior Validation Engineer with The Taneja Group, where he headed the Validation Service Lab and was instrumental in starting up its vSphere Virtual Volumes practice. He's on X @vDoppler.