How-To
Setting Up Open-Source ntopng for Network Visualization and Monitoring
In this series of articles, I am looking at how to monitor my home/home lab LAN. In my first article, I probed my network to see what devices were on it and where they were located. In my next article, I explained what ntopng is and why I am using it to monitor my internet traffic.
Now I'll explain how I set up and installed ntopng. But before I do that, I want to revisit where ntopng will sit in my network and how I redirected traffic to it.
Where to Place ntopng on My Network
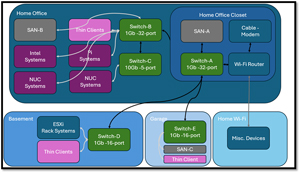
My LAN is spread throughout my house and has dozens of devices and multiple switches.
 [Click on image for larger view.]
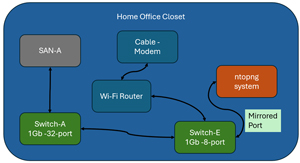
Due to the architecture of my LAN, it would be difficult to monitor the communication between all the devices, so I settled on monitoring just the traffic going to and coming from the Internet by placing an inexpensive managed switch in front of the Wi-Fi router and mirroring the traffic on the cable modem port to the port connecting the ntopng system to it.
 [Click on image for larger view.]
There are other ways I could have captured the data.
I could have bought a network tap. These are devices that professional network administrators use to redirect and capture traffic. The cheapest one I could find was $200.
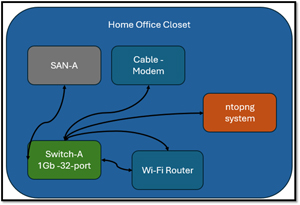
Switch-A is a managed switch with mirroring capabilities so that I could have mirrored the port to the Wi-Fi router, but the traffic on this switch was already heavy, and I didn't want to increase the network load on it. I also wanted a way to remove ntopng if I had issues with it.
I could have rerouted the Wi-Fi router back to Switch-A and then to the cable modem, but it would have looked overly complicated and may have presented some nasty loopback situations.
 [Click on image for larger view.]
I considered configuring a Linux system to act as a bridge between the Wi-Fi router and switch and had it run ntopng as will. However, a managed switch would offer better performance and reliability than a Linux box.
 [Click on image for larger view.]
After evaluating the alternatives, I feel confident about my network topology.
What to Run ntopng On
The next thing I needed to decide on was what platform to run ntopng on. Compatibility should not be a problem as ntopng is compatible with both x64 and arm systems and I had many older Intel boxes and Pi that I could reuse.
x64 systems seem to be the most widely used and supported systems for ntopng. But arm systems are known for their lower power consumption and cost. However, I was a little bit leery about using a Pi system as I was unsure if its performance could match that of an x86-64 for high-volume network monitoring, and there may be limited compatibility with software and hardware for the Pi systems.
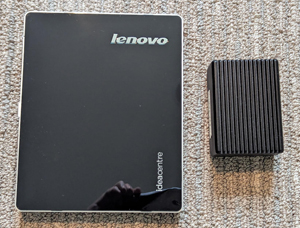
After digging through my stack of unused systems, I narrowed my choice down to a Pi 4 with 8GB of RAM and an old (circa 2014) Lenovo 10115 ideacenter Q 10115 with a 2-core Intel Celeron 1017U 1.6Ghz 4GB 500GB SSD.
 [Click on image for larger view.]
In the end, I decided to go with the Pi 4 due to its small form factor, low power consumption, and low heat output. Many other people in the community have used them successfully as ntopng servers running Raspberry Pi OS.
Creating a ntopng Pi Server
Installing ntopng on my Pi 4 involved just a few steps. Below is how I did it.
-
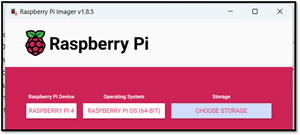
I burned a fresh image of Raspberry Pi OS onto a 64GB PNY Pro Elite MicroSD card.
 [Click on image for larger view.]
- Place the MicroSD in the Pi 4, boot the Pi up, and log into it.
-
I find it easier to work from a Windows terminal shell when configuring systems. If you would like to use SSH on the Pi, do the following:
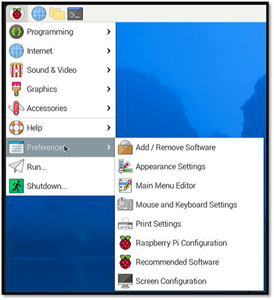
- From the Pi drop-down menu, select Preferences, then select Raspberry Pi Configuration
 [Click on image for larger view.]
- Click the Interfaces tab, toggle SSH to Enable, and click OK.
- Log on to using SSH by entering user01@<IP address of the Pi> from a console on your windows system
-
Update all the packages
-
Add ntopng from its repository to the system
Configure ntopng
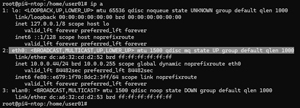
You will need to identify the network interface you will use. To do this enter ip a.
 [Click on image for larger view.]
I will be using eth0.
Once the interface is identified, you will need to configure ntopng by editing its configuration file. This file is located at /etc/ntopng/ntopng.conf.
These are the lines that I configured or verified. You will need to configure them to match your environment.
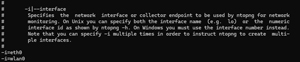
-
Network Interfaces: Specify the network interfaces that ntopng should monitor. I used the ethernet port, so I configured
-
HTTP Port: I used the default HTTP port for the ntopng web interface
-
Local Networks: Define the network to be monitored. In my case, I wanted to monitor all the devices on my network.
Starting the ntopng Service
You can start the service manually and have it start up on boot.
-
Start the service by entering
- sudo systemctl start ntopng
-
Enable ntopng it to start on boot
- sudo systemctl enable ntopng
Verifying that ntopng Service Started
After starting ntopng I wanted to verify that it had started, and that the GUI was on port 3000.
-
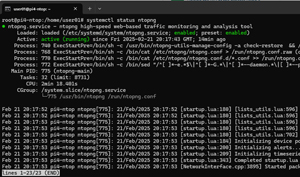
Verify that the ntopng service is running
- systemctl status ntopng
 [Click on image for larger view.]
-
Verify that the GUI is listening on port 300
- lsof -i
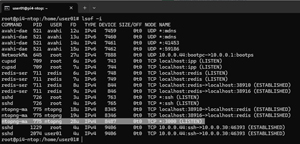 [Click on image for larger view.]
Monitoring Wi-Fi Traffic
Once I had ntop configure for the wired network traffic, I monitored Wi-Fi traffic by enabling Wi-Fi on the Pi, connected to the Wi-Fi router, and enabled ntopng to monitor the Wi-Fi interface (wlan0) in the ntopng configuration file.
 [Click on image for larger view.]
To reread the configuration file, I restarted the ntopng service by entering systemctl restart ntopng.
Viewing the ntopng Dashboard
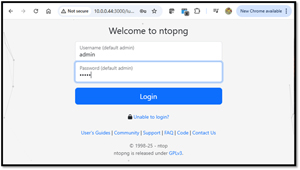
I accessed the ntopng dashboard by navigating to http://10.0.0.44:3000 in a web browser, where 10.0.0.44 is the IP address of the Pi device that ntopng was running on.
 [Click on image for larger view.]
I logged in using the default user "admin" and password "admin." Once I logged in, I was prompted to change the password.
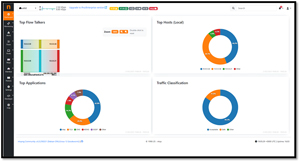
In the few minutes between configuring my system and logging in in ntopng, it had already started collecting data and displaying it in the dashboard.
 [Click on image for larger view.]
Configuring Port Mirroring on the Switch
I discovered the IP address of the TP-link TL-SG108E switch using TP-Links Easy Smart Configuration Utility, which I installed on my laptop.
Below is how I set up port mirroring on my managed switch.
- I accessed the web management interface from my web browser by entering the switch's IP address.
- I clicked the Monitoring tab
- From the dropdown menu, I selected Port Mirroring
-
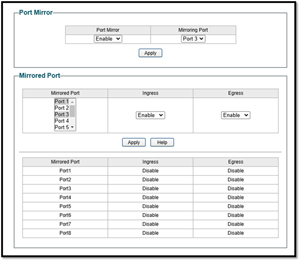
In the Port Mirroring settings, I did the following:
- I set the source port to the port where the cable modem was connected, which was the port I wanted to monitor.
- I set the destination port to the port the Pi was connected to. This is where the mirrored traffic will be sent.
- I set the mirror mode to Both monitor incoming and outgoing traffic.
- I clicked Save and Apply
 [Click on image for larger view.]
In this article, I described how I set up ntopng on a Raspberry Pi 4 by connecting it to a managed switch with port mirroring capability between the Wi-Fi router and a switch.
I chose Raspberry Pi 4 for its low power consumption and compact size. To install ntopng on Raspberry Pi OS, necessary dependencies were installed, the ntopng repository was added, and network interfaces and HTTP ports were configured. Once configured, I could access the ntopng dashboard via a web browser.
In my final article on ntopng, I will show you how I used it to analyze network traffic.