Measuring Bandwidth With iPerf
As virtualized infrastructures get more complicated, sometimes you need a way to troubleshoot things quickly, in simple terms above the infrastructure. One of the areas I've looked closely at is network throughput. This is partly because I've worked in a lot of virtualized infrastructures that use more NFS, SMB3 or iSCSI communication for VMs, and less fibre channel, as I've gone along.
While using the network storage protocols in lab environments in particular, I don't always separate interfaces that provide the storage network (iSCSI, NFS, SMB3 and so on) from the network interfaces that guest VM operating systems use. Whether in a lab or production setting, the iPerf tool is a handy way to measure network throughput above the infrastructure. The latest iteration is iPerf3.
If you're not familiar with iPerf3, it's time for an introduction. According to its Web home, iPerf3 is principally developed by ESnet and the Lawrence Berkeley National Laboratory, and released under a three-clause BSD license. I think it's the easiest way to do active measurements of network bandwidth between devices at the operating system level. The best part is that support, once limited to Windows and Linux, now includes Android, iPhone and MacOS X as well. (Note that the latest version, iPerf3, isn't backwards compatible with the first version).
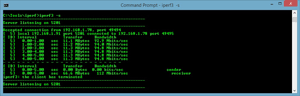
I recommend putting this tool in your arsenal or downloading it as needed. It doesn't need to be installed (at least on Windows; I haven't used the Linux version of iPerf3, but note that some Linux distributions have it embedded as Iperf), and can function as a standalone tool. On a Windows system, I run the server side element as iperf –s
(this is shown in Figure 1).
 [Click on image for larger view.]
Figure 1. iPerf3 clearly shows throughput and network communication.
[Click on image for larger view.]
Figure 1. iPerf3 clearly shows throughput and network communication.
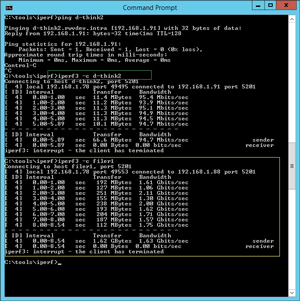
Once that server process started, I went to another system and ran iPerf3 to connect to the first system. The –s parameter was run first to establish a server, then the –c parameter (and the host name),
to connect to it from a different system. It looks like this: like this: iperf3 –c d-think2. In Figure 1, you can see the connection established. Figure 2 shows the connection being made (highlighted in green).
 [Click on image for larger view.]
Figure 2. Showing the connection being established.
[Click on image for larger view.]
Figure 2. Showing the connection being established.
Notice in Figure 2 that the second connection was much faster. This is because both the iPerf3 client and server roles are VMware VMs on the same port group. We'd expect to see a high throughput here as they use CPU resources for network transfer, rather than actively going over the network interface.
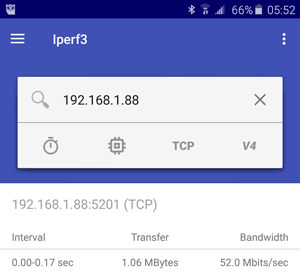
I also had a chance to install the very handy Android application to communicate to these VMs with iPerf3. While this is of course only accessible via Wi-Fi, it's an additional way to test the experience from the datacenter down to a device. The Android interface is shown in Figure 3.
 [Click on image for larger view.]
Figure 3. iPerf3 (the capitalization is different in the PC and mobile device versions) on an Android device.
[Click on image for larger view.]
Figure 3. iPerf3 (the capitalization is different in the PC and mobile device versions) on an Android device.
Practically speaking, this is very helpful for testing things like communication between VMs in different infrastructures. From a network role perspective, iPerf3 can also be helpful in an infrastructure that is very "stacked" on top of itself.
So learn iPerf3, and the next time someone says an application is slow, use this handy tool to look for clues, especially to and from other VMs that aren't reporting any issues.
Posted by Rick Vanover on 03/24/2016 at 2:26 PM