How To Guy
How vCenter Operations Can Help You
Now that you have an idea how vCenter Operations work (yeah, that easy), here are a few tips on what I use it for.
Last time, I provided a feature overview of vCenter Operations and showed how to download and configure it. This time, let's show off the vCenter Ops interface and demonstrate how it works with vSphere to manage performance and analyze capacity.
Getting Started A Few Tips
The Web interface is for configuration, not for daily usage. You'll spend 99.9 percent of your time using the vSphere Client Web interface for vCenter Ops.
Also, you must enter a license code in the vSphere client to even be able to evaluate vCenter Ops. This could be a permanent license key or an evaluation license.
Initially, vCenter Ops is going to spend all its time trying to learn what is "normal" for your virtual infrastructure, so be patience as it does so.
Nitty-Gritty vCenter Ops
To understand what you see in vCenter Ops, you have to understand the use of the numerical values assigned to Workload, Health, and Capacity (see Fig. 1)
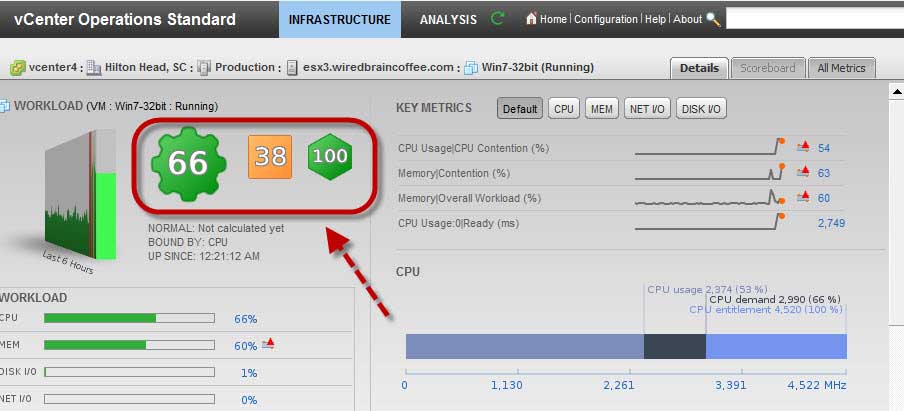 |
Figure 1. Workload, Health and Capacity indicators in the vCenter Operations interface. (Click image to view larger version.) |
Here's the quick reference of these "Key Performance Indicators", or KPI:
Workload represents object resource demand (ie: CPU, Memory, Disk, Network) and ranges from 0-100+. If 100+ then more resources are being demands than are available.
Health represents the status of the object and all objects below it in terms of the quantity of historical thresholds that have been recently violated. The range for this value is 0-100 where 0 is bad health and 100 is good (reverse of workload). For example, if an object is green then its health score is between 76-100.
Capacity shows how close an object is to exhausting the resources available to it. Examples of resources are CPU, memory, network capacity, and even disk space. The capacity score is based on long-term trending and ranges from 0-100 with 100 being the best. If an object scores between 26-100 then it is green and won't run out of resources within the next 120 days. On the other hand, if an object is red, it will run out of resources in the next 0-5 days.
I'm a practical guy and just wanted to know how vCenter Ops could really change the daily life of a VMware Admin. Here are three that I have seen:
1. Quick overview of virtual infrastructure health
I really like how it allows you to quickly hide the objects with a specific status. If you are just looking to identify problem areas, you can easily hide all "green" objects with a good status. If an object of the VI is yellow or red, hover your mouse over it or double-click on it to see more.
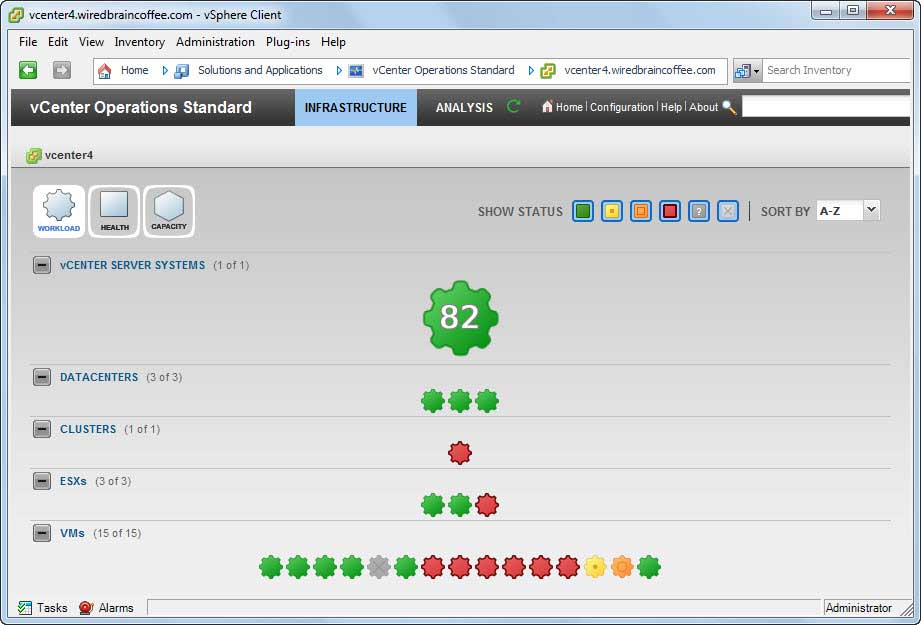 |
Figure 2. vCenter Operations gives a nice overview of infrastructure health. (Click image to view larger version.) |
Once you understand the KPIs, you can quickly look at scores and colors and tell where the problems are. No matter the size of your virtual infrastructure, you'll appreciate the ability to solve capacity problems fast (and hopefully prevent them before they happen).
2. Quickly determine the root cause of resource contention
When drilling down into the VM (or host, or cluster, or vCenter server), it is easy to see where the problem is, as vCenter Ops will tell you that the VM (for example) is "memory bound" or "CPU bound.
Fig. 3 shows a VM that is suffering memory and network contention. You can easily see this because the workload score is 160, the memory workload is at 160 percent and the network workload is at 100 percent.
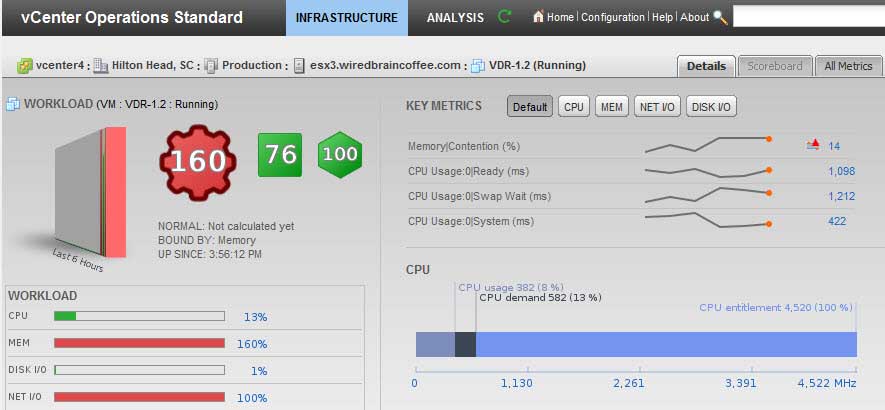 |
Figure 3. This VM is losing its mind and being a bit detached, so to speak. (Click image to view larger version.) |
3. Correlation of vSphere Events and Resource Contention Events
Events that occur in vSphere (like powering on a VM) are correlated with performance events so that you can see how the two are connected (ie: powering on a bunch of VMs maxed out the memory resources on the cluster).
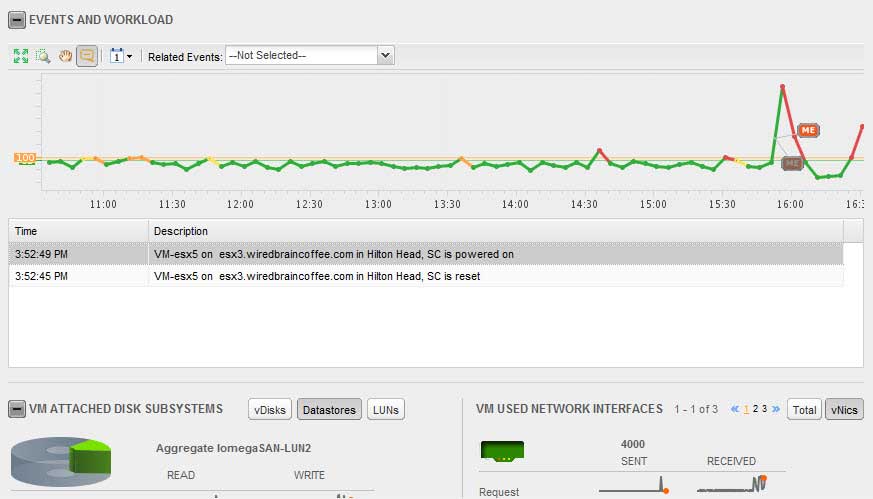 |
Figure 4. When something goes wrong, you'll want to know those problems will affect performance in other parts of your infrastructure. (Click image to view larger version.) |
Resources To Learn More
Since vCenter Ops is relatively new, there aren't any independent learning and education resources available for it at the moment. VMware does, however, have some nice resources that they published for it the day that it became available. Here are some of the best resources:
You can find them all on the vCenter Ops Resources Web page.
About the Author
David Davis is a well-known virtualization and cloud computing expert, author, speaker, and analyst. David’s library of popular video training courses can be found at Pluralsight.com. To contact David about his speaking schedule and his latest project, go to VirtualizationSoftware.com.