How-To
How To Use Advanced Features of vimtop To Monitor VCSA
Learn how to reorder displayed columns, save your configurations, and capture and display historical data when monitoring VMware vCenter Server Appliance with vimtop.
In a previous article, I provided an overview of how to use vimtop to monitor the resources that your VMware vCenter Server Appliance (VCSA) is consuming. In this article, I'll show you how to use some of the advanced features of vimtop, including reordering displayed columns, saving your configurations, and capturing and displaying historical data.
I intended this article to be read by those who have a base familiarity with vimptop; if you're unfamiliar with vimtop or need a quick refresher, I strongly suggest that you first read my previous vimtop article.
Reordering vimtop Columns
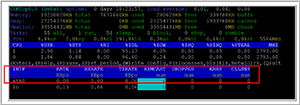
Sometimes, it makes sense to reorder the displayed columns in vimtop. For example, the default for the network view doesn't place the receive columns together (Figure 1).
 [Click on image for larger view.]
Figure 1. Network defaults.
[Click on image for larger view.]
Figure 1. Network defaults.
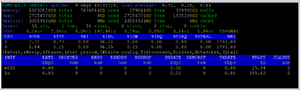
To reorder the columns, use the left and right arrow keys to navigate to the column you want to move, and then use the comma key (,) to move the column to the right or the period key (.) to move the column to the left. Repeat this action until you have your columns positioned as you'd like. Of course, you can add other metrics to view if you prefer; I explained how to add columns in my previous article. Figure 2 shows my network screen after I added and repositioned columns in this view.
 [Click on image for larger view.]
Figure 2. Repositioned columns.
[Click on image for larger view.]
Figure 2. Repositioned columns.
To delete a column, use the left and right arrow keys to highlight it, and then press the Delete key.
Saving Your vimtop Configuration
Unless you manually save your configuration before you exit vimtop, your configuration will be lost. To save your configuration, press "w." Not only will this save your configuration in general, but it will also configure vimtop to bring up this same view when you start up next time. For example, if you want vimtop to start on the network view, simply enter "w" while on that view.
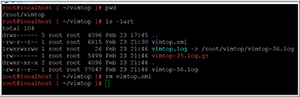
I could not find a way to reset or delete a written view using vimtop. However, you can delete the default configuration file, /root/vimtop/vimtop.xml by using the rm command; removing this file will reset all of the vimtop views to their defaults (Figure 3).
 [Click on image for larger view.]
Figure 3. The vimtop configuration file.
[Click on image for larger view.]
Figure 3. The vimtop configuration file.
You can create and use individual configuration files by using the -c switch when you start vimtop. For example, if you enter vimtop -c TJFNetwork.xml when you start vimtop and then enter "w" after you've configured vimtop to your liking, it will save your configuration to TJFNetwork.xml, rather than to vimtop.xml. To use a saved configuration file, specify it with the -c switch when you start vimtop.
Saving vimtop Data
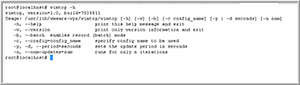
For the most part, vimtop is used interactively to diagnose issues in real time, but sometimes you need to either store data for later analysis or perform an unattended capture of data. The vimtop help screen has a list of switches that can be used with it. You can see these switches by entering vimtop -h (Figure 4).
 [Click on image for larger view.]
Figure 4. Capturing data for vimtop.
[Click on image for larger view.]
Figure 4. Capturing data for vimtop.
To stream the output of vimtop to a file rather than the screen use the -b switch and set the number of seconds you want between refreshes with the -p switch and the number of iterations with the -n switch and then redirect the output to a file. For example, entering vimtop -b -p10 -n6 > TOP01.out will record the data for vimtop in a file named TOP01.out by taking 6 data samples every 10 seconds, which will capture 60 seconds of data. The first line of data in your file will be the vimtop header and each sequential line of data will be a line of data; the fields in the file will be separated by commas. You'll need to manually parse this data to retrieve the information that you want.
Figure 5 shows an example of capturing the output top and parsing the output using a loop and the cut command:
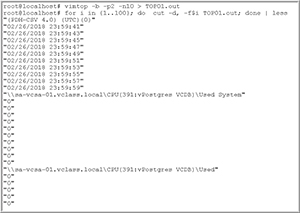
vimtop -b -p2 -n10 > TOP01.out
for i in {1..1000}; do  cut -d, -f$i TOP01.out; done | less
The output shows that the first comma-separated value is time and date of when that data was captured and then the metric and the values of that metric.
 [Click on image for larger view.]
Figure 5. Paring a top batch file.
[Click on image for larger view.]
Figure 5. Paring a top batch file.
I found it difficult to associate a metric with its position in the output file, so I created a vimtop output file that only captured a single iteration and then I created a loop to list the values and the line on which they could be found:
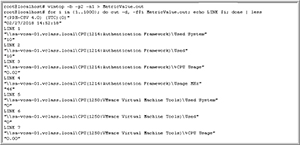
vimtop -b -p2 -n1 > MetricValue.out
for i in {1..1000}; do  cut -d, -f$i TOP01.out; echo Line $i; done | less
 [Click on image for larger view.]
Figure 6. vimtop values per line.
[Click on image for larger view.]
Figure 6. vimtop values per line.
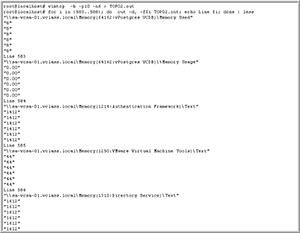
From this output I was able to see that position 583-588 held the memory metrics in which I was interested. I captured the data every 10 seconds, six times and then I created another loop to display the memory metrics of the system over this time period. The output is shown in Figure 7.
vimtop  -b -p10 -n6 > TOP02.out
for i in {583..588}; do  cut -d, -f$i TOP02.out; echo Line $i; done | less
 [Click on image for larger view.]
Figure 7. vimtop memory metrics.
[Click on image for larger view.]
Figure 7. vimtop memory metrics.
When in batch mode all the vimtop metrics (CPU, memory, disk and network) can be captured and a configuration file can be used. I used this feature to capture and then display the time stamp (field 1) and then the network metrics (fields 551-556) that I was interested in by using code. The output from the following code is shown in Figure 8:
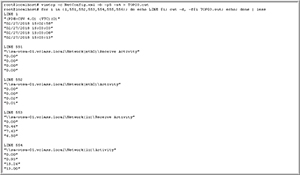
vimtop -c NetConfig.xml -b -p5 -n4 > TOP03.out
for i in {1,551,552,553,554,555,556}; do echo LINE $i; cut -d, -f$i TOP03.out; echo; done | less
 [Click on image for larger view.]
Figure 8. Network information from batch mode.
[Click on image for larger view.]
Figure 8. Network information from batch mode.
Other Useful Commands
There are a few other useful commands that you should know in order to fully utilize vimtop:
- To scroll down the list of processes in the task view use the up and down arrows.
- To set the width of the displayed columns press "l"; to restore them, press "x."
- To see the version of vimtop you're running enter vimtop –v.
- To set the screen refresh rate to 10 seconds enter vimtop -p 10.
Wrapping Up
In these past two articles, I showed you how to access vimtop, use it to monitor the resource consumption of your VCSA, write vimtop configuration files, and store and replay vimtop data. I also shared with you some of the other commands that can make vimtop more useful. Hopefully you'll add vimtop to the list of tools that you use to monitor VCSA.
About the Author
Tom Fenton has a wealth of hands-on IT experience gained over the past 30 years in a variety of technologies, with the past 20 years focusing on virtualization and storage. He previously worked as a Technical Marketing Manager for ControlUp. He also previously worked at VMware in Staff and Senior level positions. He has also worked as a Senior Validation Engineer with The Taneja Group, where he headed the Validation Service Lab and was instrumental in starting up its vSphere Virtual Volumes practice. He's on X @vDoppler.