How-To
Hands-On with ControlUp Edge DX, Part 1: Architecture & Monitoring
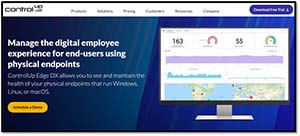
Tom Fenton begins a 3-part series on this new offering, used for monitoring and managing physical devices.
ControlUp has traditionally specialized in monitoring and managing virtual desktops and the infrastructure on which they run. On May 13, however, they departed from this focus with their release of Edge DX, a product for monitoring and managing physical devices.
 [Click on image for larger view.]
As more and more companies have been allowing their employees to work remotely, I have also seen an upswing of issues pertaining to the physical devices that these remote users are working with. The products that I have worked with in the past to manage devices have been problematic for a number of reasons: they are overly complicated, do not scale well, require corporate network and/or active directory connectivity, or have limited management and reporting capabilities. Edge DX was designed to mitigate these issues.
ControlUp is a privately owned, VC-funded company that has been around for over ten years and currently has over 1,500 customers worldwide. Up until the release of Edge DX, they have been focused on monitoring and, more importantly, assisting with troubleshooting and managing virtual desktops. ControlUp has a strong following of Citrix administrators, and about two years ago they formed an alliance whereby VMware resells their Real-Time DX product as Advanced Monitoring for VMware Horizon Universal License Powered by ControlUp.
In 2020, ControlUp acquired Avacee, a company that had a SaaS-based endpoint monitoring, reporting and management product that ControlUp further developed and is now releasing as Edge DX.
Architecture
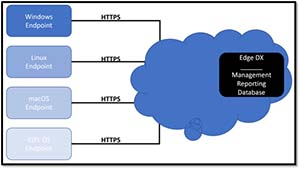
The architecture of Edge DX is straightforward and uncomplicated; an agent runs on an endpoint device and relays information to a cloud-based platform. The agent supports endpoints that are running Windows, Linux, macOS, or IGEL OS.
I found the agent to be very easy to install and to have no effect on the performance of the system on which it is running. Moreover, because the agent communicates with the cloud-based management system over standard HTTP ports, I didn't need to add additional firewall rules to these systems. The data from the agent was stored and manipulated in the cloud, so I didn't need to install or maintain any additional infrastructure. ControlUp designed the platform to be highly scalable, providing flexibility so organizations of any size can use it.
 [Click on image for larger view.]
Hands-on With Edge DX
The Edge DX management dashboard can be accessed from a link on ControlUp's SOLVE product or by directly by entering a URL in a browser.
 [Click on image for larger view.]
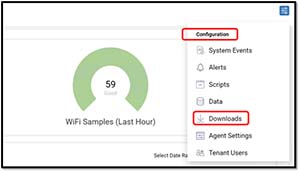
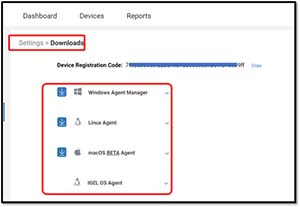
As mentioned above, deploying the agent is very easy. I went to the upper right corner of the Edge DX dashboard and clicked Configuration > Downloads.
 [Click on image for larger view.]
The Downloads page displays the registration code, which is used to associate the agent with a particular Edge DX dashboard, as well as instructions on how to install the Edge DX agent.
 [Click on image for larger view.]
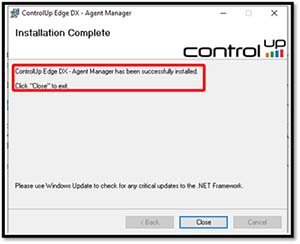
I copied the Edge DX agent installer to a Windows 10 system. I installed the agent from the command line, but I also had the option of installing it by launching the installer. The installation process took less than half a minute.
 [Click on image for larger view.]
The device was shown on the dashboard. I then installed the agent on another Windows machine and a few Linux machines. By clicking the Devices tab, I was able to see all the devices on which the agent was installed. I did not need to open the firewall or do any other configuration to these devices listed.
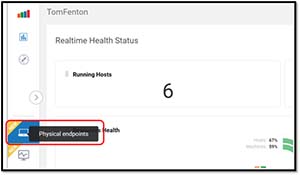
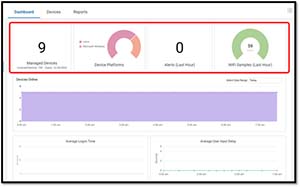
The top of the dashboard shows information about the number of devices, Wi-Fi, average logon time and average user input delay.
 [Click on image for larger view.]
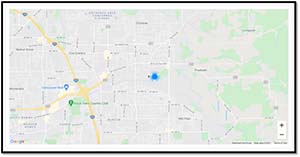
The lower portion of the dashboard shows the geographical location of the devices. All of mine were in the same location.
 [Click on image for larger view.]
I went back to list of devices under the Devices tab.
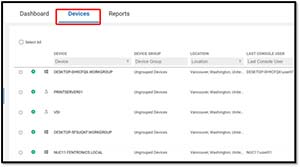 [Click on image for larger view.]
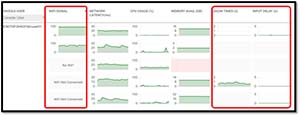
By scrolling to the right, I was able to see information for each device: whether a user was logged on, its network and resource usage and Wi-Fi signal strength – an extremely valuable piece of information when diagnosing “last 50 feet” connectivity problems (i.e., problems between a device and wireless router).
 [Click on image for larger view.]
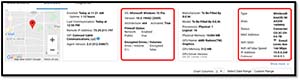
Clicking on a device provides deeper insight about that device. When I did this, I found the top portion to show static information about the device, such as OS, hardware, networking configuration and location. I also found information about the wireless NIC and firewall status.
 [Click on image for larger view.]
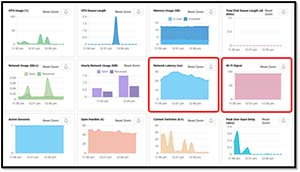
The lower section of the dashboard dynamically updates the metrics for a machine, such as CPU and RAM usage, but also includes the Wi-Fi statistics. As mentioned above, these Wi-Fi statistics are very crucial when attempting to troubleshoot the last 50 feet of connectivity.
 [Click on image for larger view.]
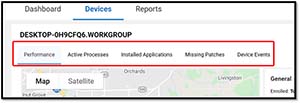
I then went through the tabs at the top of the Devices page.
 [Click on image for larger view.]
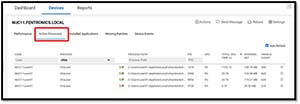
Clicking Active Processes showed all the processes currently running on my systems as well as the resources that they were consuming. I was able to sort and search the columns.
 [Click on image for larger view.]
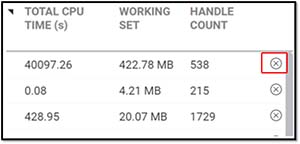
I found that the X icon on the far right of each row would let me kill that process.
 [Click on image for larger view.]
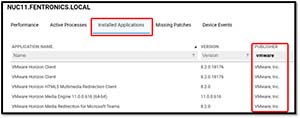
By clicking the Installed Applications and Missing Patches tabs, I found lists of information as expected. Again, the columns were sortable and filterable.
 [Click on image for larger view.]
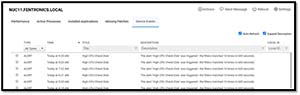
Clicking the Device Events tab showed events from Edge DX and not the OS.
 [Click on image for larger view.]
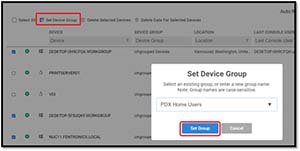
I was able to create a group of devices by clicking the Devices tab, selecting devices, and then clicking Set Device Group.
 [Click on image for larger view.]
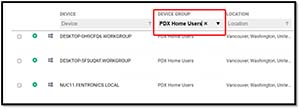
I used the Device Group column to set the group name, and then I was able to use the group name when creating future reports.
 [Click on image for larger view.]
Summary
After using Edge DX for a few weeks, I was pleasantly surprised how easy it was to get it up and running; I only needed to install the agent on the system that I wanted to monitor, and then log into the management dashboard. I didn't need to open any firewalls, and the devices didn't need to be on the corporate network or be a member of an active directory. I didn't need to set up any infrastructure to store or process the information from the device. For companies with remote workers, these factors can provide a huge advantage.
I found navigating the dashboard to be intuitive and very responsive. To access the information about the devices, I just needed to log on to a web-based management dashboard. The management dashboard was lightning fast; granted, I had less than a dozen devices in my dashboard, but I have seen demos with thousands of users and the dashboard was just as fast.
In this article, I just worked with the monitoring portion of the dashboard. Although this function was impressive, it displayed the same information that I could ordinarily get from any number of other tools. In the a href="https://virtualizationreview.com/articles/2021/06/11/controlup-edge-dx-2.aspx" target="_blank">second part of this article series, I will dive into some of the more specific aspects that differentiate Edge DX from the other tools that I have worked with in the past.
(Note: Tom Fenton is a technical marketing manager at ControlUp.)