How-To
Hands-on with ControlUp Edge DX, Part 2: Advanced Features
Tom Fenton looks at Edge DX, a new product from ControlUp that was designed to monitor and manage Windows, macOS, Linux and IGEL OS endpoint devices. He explains the information it gathers, how it displays logon and processes to help troubleshoot and diagnose issues that end users might be having.
In a previous article, I took a basic look at Edge DX, a new product from ControlUp to monitor and manage endpoint devices like laptops and thin clients. I discussed some key features of its management dashboard, and I found Edge DX to be very easy to set up and intuitive to use. In this article, I will dive deeper into some of its more advanced features, such as its ability to analyze logon and session details. I will also run a benchmark on Edge DX to see how it impacts the performance of the device on which the agent runs.
Logon Details
Edge DX supports both pre-built and custom (user-built) reports. One of the more useful reports that I found pertains to one of the more annoying experiences that an end-user can encounter: slow logon times.
There are literally hundreds of processes and events that take place when a user logs on, and to try and manually observe and track them is nigh impossible. This report, however, allowed me to easily troubleshoot logon issues.
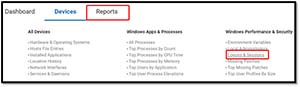
I found the report under Reports > Logons & Sessions.
 [Click on image for larger view.]
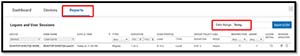
This displayed a list of user logons.
 [Click on image for larger view.]
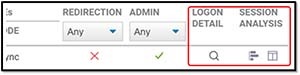
On the far right of each row is a column for logon details and session analysis.
 [Click on image for larger view.]
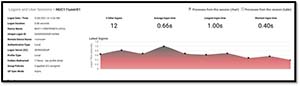
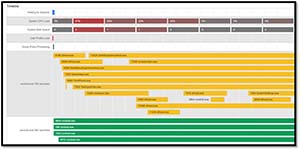
When I clicked on the magnifying glass under Logon Detail, it showed a timeline the CPU load and the disk queue during the logon. These two factors are good indicators of system overload during logon.
 [Click on image for larger view.]
It then provided a timeline breakdown of the processes that are started during logon. By looking at the metrics and processes, I found it easy to correlate why a particular process was taking so long to complete.
 [Click on image for larger view.]
By pointing to an object, I was able to see more information about it.
 [Click on image for larger view.]
Session Analysis
Not only does Edge DX track the processes that happen during logon, it also monitors the processes running during a user's session.
You can access information about processes from a user's session directly from the Logon Details dashboard.
 [Click on image for larger view.]
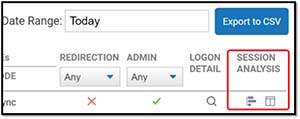
Alternatively, from Reports dashboard, you can click an icon at the upper right to show the sessions.
 [Click on image for larger view.]
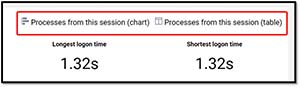
Regardless of how you access it, you can view the session details in a either chart or table format, both of which are helpful in their own way.
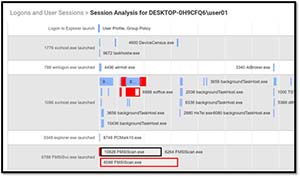
The Chart view shows all the processes that took place during a particular session.
 [Click on image for larger view.]
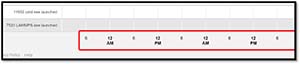
At the bottom of the chart, information about processes for the last 24 hours is displayed.
 [Click on image for larger view.]
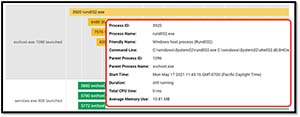
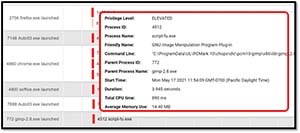
Pointing to a process will reveal more information, including the process path, resource usage and process identifier.
 [Click on image for larger view.]
You can use the chart view to help identify which processes were taking place at the same time a user was having an issue.
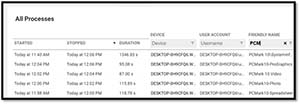
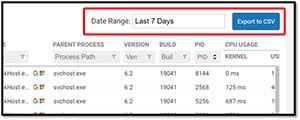
The table shows the same data but in a table format.
 [Click on image for larger view.]
This data can be sorted, filtered and set to display a specified time range. The data can then be exported via CSV if desired.
 [Click on image for larger view.]
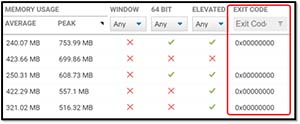
Using this information, I was able to see which applications were consuming the most resources and which processes did not exit cleanly.
 [Click on image for larger view.]
Agent Impact
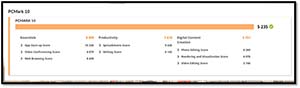
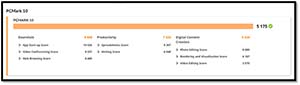
To determine the extent to which the agent was impacting the performance of my system, I ran PCMark 10 to benchmark the system, then I installed the Edge DX agent and reran the benchmark. The system that I tested was a Simply NUC Ruby R8 with an AMD Ryzen 7 4800U processor and 16GB of RAM.
 [Click on image for larger view.]
I found there to be less than a 1 percent difference in system performance with the agent installed compared to without.
 [Click on image for larger view.]
Summary
In this article, I looked at the Edge DX, a new product from ControlUp that was designed to monitor and manage Windows, macOS, Linux and IGEL OS endpoint devices. I looked at the information that it gathers, how it displays logon and processes to help troubleshoot and diagnose issues that end users might be having. I found that agent has little to no impact on the machine that it is monitoring.
In my next article on Edge DX, I will create a ControlUp script to gather information from the system and then create a custom report based on that information. I will finish up the article by creating an alert to show when a system is over-consuming resources.
(Note: Tom Fenton is a technical marketing manager at ControlUp.)
About the Author
Tom Fenton has a wealth of hands-on IT experience gained over the past 30 years in a variety of technologies, with the past 20 years focusing on virtualization and storage. He previously worked as a Technical Marketing Manager for ControlUp. He also previously worked at VMware in Staff and Senior level positions. He has also worked as a Senior Validation Engineer with The Taneja Group, where he headed the Validation Service Lab and was instrumental in starting up its vSphere Virtual Volumes practice. He's on X @vDoppler.