How-To
Zabbix: An Open-Source Monitoring Solution
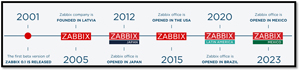
Every year at VMware Explore, I make a point to visit the smaller booths at the back of the convention hall, as this is where smaller companies tend to be located. This year was no exception, and one of the companies that caught my eye was Zabbix, a free and open-source monitoring solution. I have seen them in the past; they have been around since 2001 and have continued to grow steadily. They are based in Latvia but have offices in the US, Japan, Brazil, and Mexico.
 [Click on image for larger view.]
In this article, I will examine Zabbix's capabilities and features. In a follow-up article, I will describe how I installed Zabbix and monitored Windows and Linux systems.
What Is Zabbix
Zabbix is a powerful and flexible open-source monitoring software solution designed to monitor IT infrastructure's performance, health, and availability, including servers, networks, applications, and cloud services. Its primary purpose is to provide real-time, in-depth monitoring of various components in an IT environment, ensuring smooth operations and quickly identifying issues. Enterprises utilize Zabbix to monitor a wide range of devices, including physical hardware, virtualized systems, containers, and cloud resources. Due to its scalability, Zabbix can effectively manage both small and extremely large infrastructures, making it a popular choice for businesses of all sizes.
 [Click on image for larger view.]
Zabbix claims to have over 300,000 installations, including 54 companies on the Fortune 500 list, including such luminaries as Salesforce, Petrobras, NEC, Orange, and Airbus.
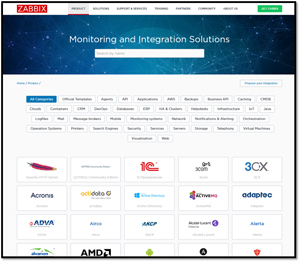
Its integration lists over 300 unique integrations.
 [Click on image for larger view.]
How Zabbix Works
At its core, Zabbix collects data from numerous OS and applications using various protocols. These include SNMP (Simple Network Management Protocol), which is often used for monitoring network devices; IPMI (Intelligent Platform Management Interface), which allows for monitoring hardware health data such as temperature, fan speed, and power usage; and JMX (Java Management Extensions), which is typically used to monitor Java applications. Zabbix can also use HTTP-based monitoring for web services and APIs.
Data collection in Zabbix is flexible, supporting both active and passive methods. In active monitoring, agents installed on the target systems push data to the Zabbix server. In passive tracking, the server regularly polls the agents to collect data. This dual approach enables greater flexibility in monitoring various types of environments and systems.
 [Click on image for larger view.]
Once data is gathered, Zabbix processes it and stores it in a relational database, such as MySQL, PostgreSQL, or Oracle. The data processing layer in Zabbix is highly efficient and capable of performing various calculations on raw data, such as computing averages, trends, or aggregated values over specific time periods. These metrics can then be used to assess system health and performance, allowing administrators to see both real-time data and historical trends. Zabbix's ability to process data at scale enables it to support enterprise-level IT operations that require continuous monitoring of thousands of devices.
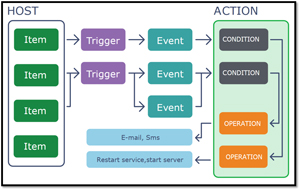
Zabbix Alerting System
Zabbix features a customizable alerting system, which extends its monitoring capabilities. Users can define triggers—logical conditions that evaluate the monitored data against pre-set thresholds. For instance, a trigger might monitor CPU usage and activate an alert when the usage exceeds 80%. When a trigger is breached, Zabbix generates an event and sends alerts or notifications. These notifications can be delivered through various channels, including email, SMS, or integrated messaging services like Slack, Telegram, or Microsoft Teams. What sets Zabbix apart is its sophisticated escalation mechanism, which ensures that unresolved issues can be escalated to higher levels of support over time, improving the response to critical incidents.
 [Click on image for larger view.]
Automation
Automation is another feature of Zabbix, helping organizations mitigate the need for constant manual intervention. Zabbix can automatically take corrective measures through actions and scripts, such as restarting a service, executing scripts, or adjusting system settings when specific conditions are met. For example, if a database server's CPU utilization spikes beyond acceptable, Zabbix can automatically trigger a script to restart the service or balance the load across other servers. This automation reduces downtime and helps maintain the smooth operation of critical systems, eliminating the need for human intervention.
Dashboards and Visualization
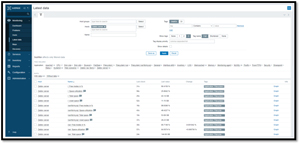
Most of the time, Zabbix uses dashboards to monitor its systems. For data visualization, Zabbix features a widget-based interface that enables the creation of customizable dashboards, detailed graphs, and real-time maps, providing a comprehensive view of the infrastructure.
It comes with standard dashboards, which can be customized and modified to suit specific monitoring needs, displaying key performance indicators (KPIs), trends, and alerts. Widgets enable detailed historical analysis, allowing teams to understand long-term trends and identify potential capacity issues.
Zabbix supports sophisticated reporting, offering scheduled or on-demand reports that are customized to focus on specific metrics or performance areas. These features enable businesses to more effectively monitor their overall infrastructure health and identify areas for optimization or potential risks.
 [Click on image for larger view.]
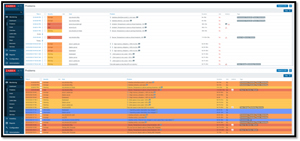
Their color-coded dashboards make it easy to identify and address problems.
 [Click on image for larger view.]
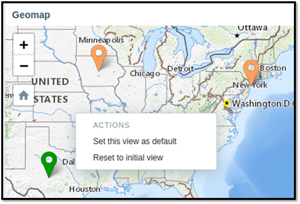
It has a geomap widget that displays the location of the systems being monitored.
 [Click on image for larger view.]
In terms of configuration and integration, Zabbix has numerous predefined templates that simplify the process of monitoring hardware, software, and services. These templates contain preset monitoring configurations and metrics tailored explicitly to various systems, including Cisco network devices, VMware virtual environments, and Linux and Windows servers. This templated approach saves time and reduces the likelihood of configuration errors.
REST API
Zabbix features REST APIs, enabling seamless integration with external systems. These APIs enable developers to interact with the Zabbix server programmatically, allowing for the automation of configurations, the retrieval of monitoring data, and the creation of custom integrations with third-party applications.
Thoughts on Zabbix
Zabbix appears to be a powerful monitoring tool. Its open-source nature enables it to be extended with custom scripts, plugins, and modules, allowing it to be tailored to organizations' specific needs. It supports agent-based monitoring for detailed data collection and agentless monitoring through various protocols, allowing it to monitor systems where installing an agent might not be feasible. The flexibility to adapt to different environments, combined with its robust feature set, makes Zabbix a comprehensive monitoring solution capable of handling even the most complex IT infrastructures.
I have friends who use Zabbix and have been pleased with it. It seems to be well-regarded and widely used in the IT community, where it is recognized not only for its flexibility but also for its depth of monitoring capabilities.
In my next article, I will guide you through installing a Zabbix server. In another article, I will demonstrate how to monitor Windows and Linux systems using it.
About the Author
Tom Fenton has a wealth of hands-on IT experience gained over the past 30 years in a variety of technologies, with the past 20 years focusing on virtualization and storage. He previously worked as a Technical Marketing Manager for ControlUp. He also previously worked at VMware in Staff and Senior level positions. He has also worked as a Senior Validation Engineer with The Taneja Group, where he headed the Validation Service Lab and was instrumental in starting up its vSphere Virtual Volumes practice. He's on X @vDoppler.