How-To
Installing Zabbix, an Open-Source Monitoring Solution
In a previous article, I provided an overview of Zabbix, a scalable, open-source monitoring solution used to track the performance and availability of IT infrastructure, including servers, networks, applications, and cloud services.
It collects data using protocols such as SNMP, IPMI, and JMX, supporting agent-based and agentless monitoring. Zabbix processes and stores this data in a relational database, offering real-time insights and historical analysis through customizable dashboards, graphs, and reports. It includes an alerting system with triggers and automation features that enable corrective actions to be performed without human intervention.
Zabbix can even be extended via its REST APIs. Many have integrated with other IT products and services, including Service Now (SNOW).
In this article, I will walk you through the process of setting up Zabbix server.
Installing Zabbix in 10 Minutes
On Zabbix's website, a banner proclaims that it can be installed in 10 minutes and is completely free.
 [Click on image for larger view.]
Before I put the installation claim to the test, let's examine the components that comprise a Zabbix environment.
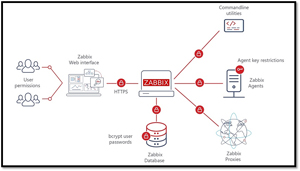
Zabbix Architecture
The heart of Zabbix is its server, which is the central component responsible for processing the collected data. It stores configuration information, gathers data from the agents, and executes various monitoring tasks. The server processes and analyzes data to provide real-time insights and issue alerts based on predefined triggers.
 [Click on image for larger view.]
Zabbix stores its configuration settings, collected metrics, and historical data in a relational database.
Zabbix utilizes agents installed on systems to collect detailed metrics and transmit them to the Zabbix server for processing.
Users interact with Zabbix through a web interface that features customizable dashboards, graphs, and reports, making it easy to visualize and interpret the data it has collected and processed.
Zabbix can use proxies as intermediaries between the monitored devices and the server in larger installations. They collect data from agents and forward it to the server, reducing the load on the central server and improving scalability.
Zabbix provides REST APIs that allow integration with other IT systems and services. These APIs enable automation, customization, and extended functionality, making Zabbix adaptable to various organizational needs and requirements.
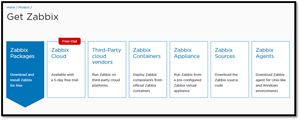
Downloading and Installing Zabbix
Zabbix can be used in a wide range of ways, from installing it locally to running it in their cloud.
 [Click on image for larger view.]
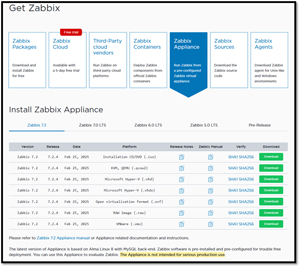
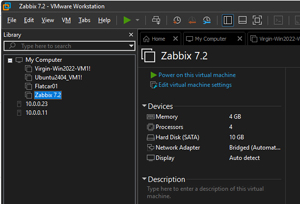
After examining the various installation options, I decided to use a VMware Appliance. However, the appliance is not recommended for serious product use.
The requirements for the Zabbix server VM were very light: It requires only 1.5 GB of RAM, 8 GB of Disk space, and 2 CPU cores.
 [Click on image for larger view.]
The Zabbix appliance is compatible with various hypervisors, including Hyper-V, KVM, and VMware. The VMware appliance will only work with Workstation, which can be obtained for free. This is the appliance that I will use.
I was not required to register or provide Zabbix with an email address to download the small (435 MB) VMware appliance. The appliance is based on Alma Linux 8 with MySQL backend. Zabbix software is pre-installed and pre-configured.
 [Click on image for larger view.]
Once it was downloaded, I unarchived it and installed it on Workstation, which was running on my laptop.
First Login
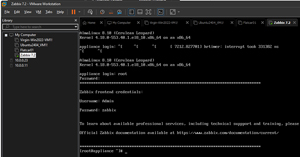
After starting the VM, I was presented with a login prompt. I logged in as root using the default password zabbix.
 [Click on image for larger view.]
Most work is accomplished using the web interface, accessed at http://<virtual machine's IP> with the username Admin and password Zabbix.
 [Click on image for larger view.]
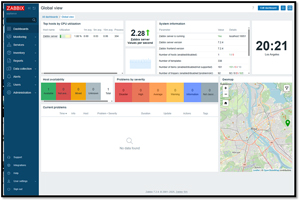
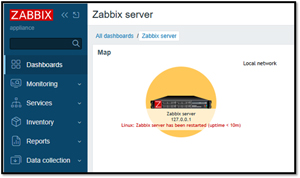
I found that Zabbix was monitoring the system on which it was installed, which I found very helpful as it allowed me to view dashboards without installing the agent on any other systems.
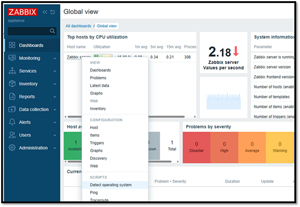
Clicking a host lets you view, configure, and run scripts against the system.
 [Click on image for larger view.]
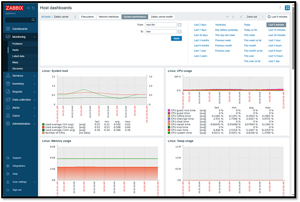
Clicking on a system and selecting Dashboards will bring you to the System Performance dashboard, which displays widgets that show information about the system's performance.
 [Click on image for larger view.]
This includes metrics about the CPU, RAM, storage and network interfaces.
The Zabbix host dashboard is a comprehensive interface that provides an array of real-time metrics and vital information about the system being monitored. It includes several widgets and sections that display:
- Current System Status: An overview of the health and performance of the host, including CPU load, memory usage, disk space, and network traffic. This allows administrators to quickly identify any abnormalities or performance bottlenecks.
- Historical Data Graphs: Visual representations of various metrics over time, helping in trend analysis and capacity planning. These graphs can be customized to show specific time ranges and parameters.
- Trigger Status: Information on active triggers, which are conditions set to alert administrators about potential issues. The status section highlights any unresolved problems and their severity.
- Event Log: A chronological log of events and actions taken by Zabbix. This includes alerts, automatic responses, and any manual interventions made by administrators.
- Inventory Data: Details about the hardware and software components of the monitored host. This can include information such as the operating system version, installed applications, and hardware specifications.
- Network Map: A visual layout of the network topology, showing how the host is connected to other systems and devices. This can help understand the broader network context and dependencies.
These elements collectively provide a comprehensive overview of the host's performance and health, enabling administrators to maintain optimal functionality and respond quickly to any issues.
Migrating Zabbix from Workstation to ESXi
As mentioned above, I was running Zabbix on VMware Workstation, but once I verified that it was working correctly, I wanted to move it to one of my vSphere environments and run it on one of my ESXi servers. There are several ways to accomplish this. I could have exported it as an OVF/OVA file and then used that to install it on vSphere, but I decided the most straightforward way was to upload the Workstation VMs to ESXi, as you can manage an ESXi host from VMware Workstation.
To do this, I did the following:
- From VMware Workstation, I navigated to File > Connect to Server.
- I entered the ESXi server's name, username, and password, and clicked Connect.
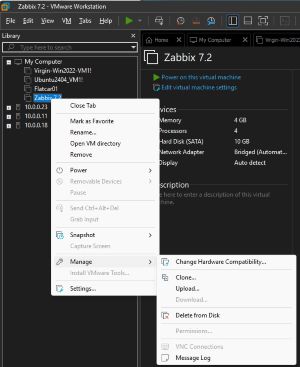
- I power off the Zabbix VM.
- I selected the Zabbix VM and navigated to Manage > Change Hardware Compatibility.
 [Click on image for larger view.]
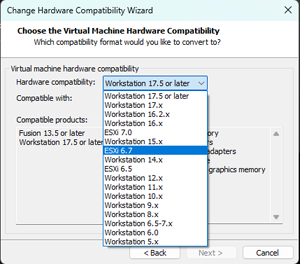
- I selected the compatible version of the VM hardware (ESXi 6.7).
 [Click on image for larger view.]
- I opted to clone the machine so that the original would still run Workstation if I had any issues.
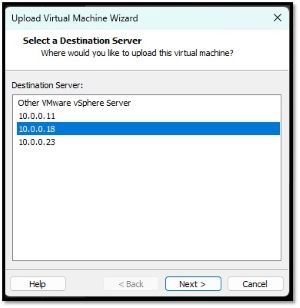
- I selected the new VM and navigated to > Manage > Upload. I selected the ESXi server and the datastore that I wanted to use.
 [Click on image for larger view.]
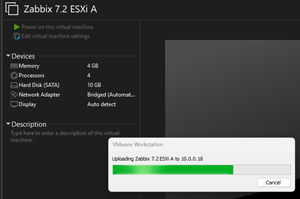
As the VM was being transferred, a widget indicated its progress.
 [Click on image for larger view.]
I then logged into my vCenter Server and saw that the VM had been copied from the VMware Workstation to the ESXi server.
I could power on the Zabbix ESXi VM without any issues, but it notified me that it had been restarted.
 [Click on image for larger view.]
Installing Zabbix on Bare Metal
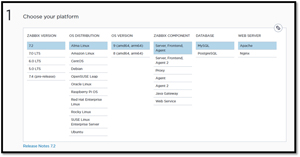
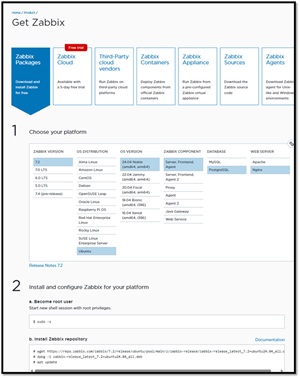
Even though I used an appliance to install Zabbix, for production use, most people will want to install it on a pre-existing Linux instance. Zabbix supports all major operating system distributions.
 [Click on image for larger view.]
To do this, you select the Zabbix version, Linux distribution, components, database, and the web server you want to use. It then presents you with all the necessary commands for installation.
 [Click on image for larger view.]
The web page will display the exact commands you need to install it on your Linux distribution.
In my next article, I will deploy its agent to Windows and Linux systems and look deeper into some of its integrations.