How-To
Monitoring Windows and Linux Systems Using Open-Source Zabbix
In previous articles, I took a look at Zabbix, a scalable, open-source monitoring solution designed to track the performance and availability of IT infrastructure, including servers, networks, applications, and cloud services.
It collects data using various protocols and supports both agent-based and agentless monitoring of systems. Zabbix processes and stores this data in a relational database, offering real-time insights and historical analysis through customizable dashboards, graphs, and reports. Zabbix can even be extended via its REST APIs. It can integrate with other IT products and services, including Service Now (SNOW).
This article will explain how I set up Zabbix and monitor Windows and Linux systems.
Zabbix on Windows
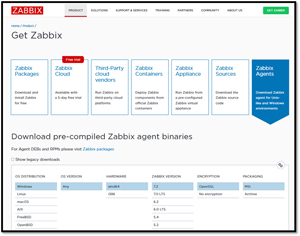
To monitor my Windows system, I needed to install the Windows Zabbix agent, which can be freely downloaded.
 [Click on image for larger view.]
I chose the 7.2 MSI installation package, which was downloaded in a matter of seconds.
To install the Zabbix agent on a Windows system, I did the following:
-
I ran the installer on my Windows laptop and followed the on-screen instructions to start the installation.
 [Click on image for larger view.]
-
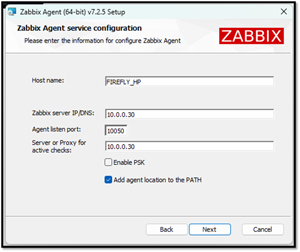
During the installation, I gave the laptop (host) a name and specified the IP address of my Zabbix server and the IP address of my Windows machine. I used the default value for the port, and I selected "Add agent location to the PATH."
 [Click on image for larger view.]
-
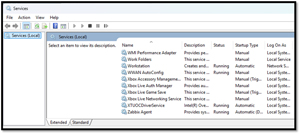
The Zabbix agent service was added to and automatically started. I verified this using the Windows Services Management Console.
 [Click on image for larger view.]
Once installed, the Zabbix agent begins collecting and reporting data on CPU usage, memory utilization, disk space availability, network throughput, process monitoring, event logs, services status, and system uptime. This information will be crucial for maintaining optimal system performance and addressing issues proactively.
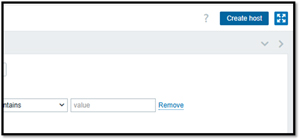
I added the laptop to the Zabbix dashboard by selecting Hosts and Create host.
 [Click on image for larger view.]
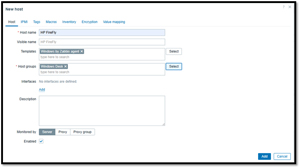
I filled out the New Host dialog with the information for the laptop.
 [Click on image for larger view.]
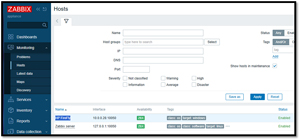
I verify that the agent is communicating with the Zabbix server by checking the Zabbix frontend for the new host entry.
 [Click on image for larger view.]
Viewing Collected Metrics
Zabbix on Windows collects a comprehensive range of metrics to ensure the health and performance of your systems, including:
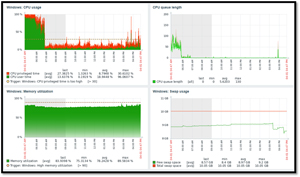
- CPU Usage: Monitors the percentage of CPU resources being used, helping identify processes that may consume excessive resources.
- Memory Utilization: Tracks the amount of physical and virtual memory being used, which can indicate potential memory leaks or the need for more RAM.
 [Click on image for larger view.]
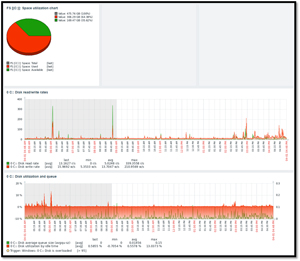
- Disk Metrics: Measures available and used disk space on all drives to prevent storage shortages that could impact system performance and disk utilization, queue length, and disk read/write rates.
 [Click on image for larger view.]
- Network Throughput: Monitors the rate of data transfer across network interfaces, helping to identify network bottlenecks and traffic patterns.
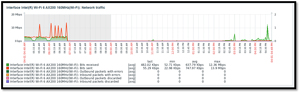 [Click on image for larger view.]
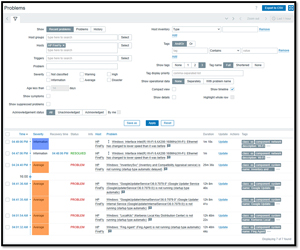
Clicking the Problems tab will show the issues reported by the system.
 [Click on image for larger view.]
Collecting these metrics enables you to gain real-time insights and conduct historical analysis, which helps maintain optimal system performance and address any issues that may arise.
Zabbix on Linux
I then installed the Zabbix agent on an Ubuntu system by selecting the Zabbix Packages and choosing the desired version to install.
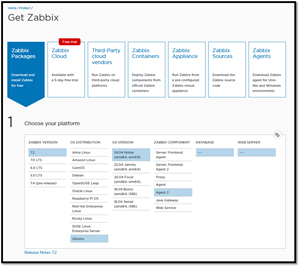 [Click on image for larger view.]
This displayed the commands I needed to run on the system to install the agent.
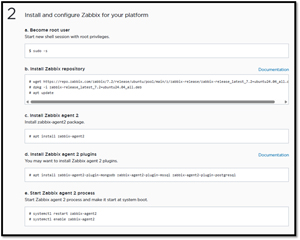 [Click on image for larger view.]
Once installed, I needed to manually edit the Zabbix config file to specify the IP address of the Zabbix server.
I then added the Linux system to the Zabbix system.
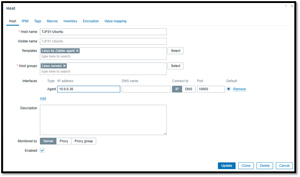 [Click on image for larger view.]
After installing the agent and adding it to the server, I was able to monitor it using Zabbix, just as I did with the Windows system.
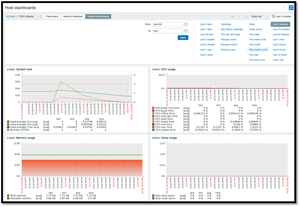 [Click on image for larger view.]
Final Thoughts on Zabbix
Before sharing my thoughts on Zabbix, I came across a free, community-driven book on Zabbix. I only had a chance to browse through the book quickly, but it appears to contain a wealth of valuable information.
Zabbix has proven its mettle over the years and is used by everyone from home labers to some of the biggest corporations in the world. I'm glad I finally had the chance to spend time with it. I found installing the server and then adding Windows and Linux systems to it very easy.
Using Zabbix to monitor my Windows and Linux systems is easy and intuitive, but I know I've only begun exploring its capabilities. In the future, I hope to integrate it with other infrastructure components, such as my NAS and routers, and delve into its alerting, automation, and other advanced features.
Zabbix is a good example of what can be accomplished with free and open-source software.
About the Author
Tom Fenton has a wealth of hands-on IT experience gained over the past 30 years in a variety of technologies, with the past 20 years focusing on virtualization and storage. He previously worked as a Technical Marketing Manager for ControlUp. He also previously worked at VMware in Staff and Senior level positions. He has also worked as a Senior Validation Engineer with The Taneja Group, where he headed the Validation Service Lab and was instrumental in starting up its vSphere Virtual Volumes practice. He's on X @vDoppler.