How-To
Hands On with ControlUp Version 8.2
Tom Fenton looks at some of new features included with this release, the biggest and most visible of which is ControlUp SOLVE, a web-based monitoring tool for end user computer environments.
ControlUp 8.2, the newest release for this monitoring, troubleshooting, and remediation solution, was released in February of 2021. In this article, the first in a two-part series on this release, I will take a look at some of new features included with this release, the biggest and most visible of which being ControlUp SOLVE, a web-based monitoring tool for end user computer (EUC) environments. In the next article, I will focus on monitoring Horizon RDSH sessions with this update.
By the way of background, I earlier wrote a short article about ControlUp and then did a follow-up piece later. Since writing those articles, I have had more time to work with ControlUp, and I have come to appreciate its power -- especially its ability for automation and how it can remediate issues in an EUC environment.
As a side note, VMware sells ControlUp as VMware Advanced Monitoring for Horizon Powered by ControlUp, per VMware's announcement.
SOLVE
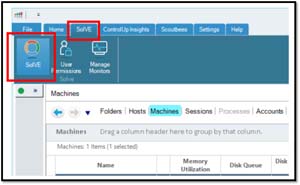
SOLVE allows users to monitor an EUC environment using a web-based dashboard. As SOLVE is a SaaS app, it not only allows you to monitor your EUC environment from any location, but also allows you to monitor very, very large (i.e., NOC large) environments. ControlUp's on-premise console is still available, but SOLVE allows you to view the same data from a web browser.
While I accessed SOLVE from the ControlUp console, it can also be accessed directly from a URL.
 [Click on image for larger view.]
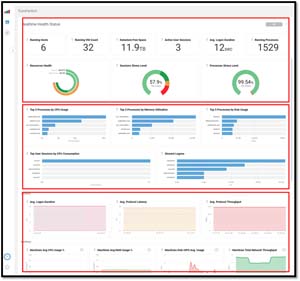
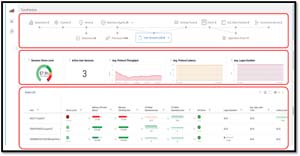
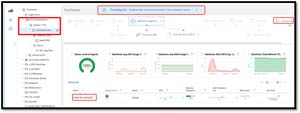
Once I logged in to SOLVE, I was presented with an attractive, modern dashboard comprised of multiple widgets based on information updated in real-time. The top row displayed the overall health and status of my EUC environment, and the middle showed the objects (e.g., machines, sessions, etc.) with the highest activity. The lower portion displayed graphs of key metrics in my environment.
 [Click on image for larger view.]
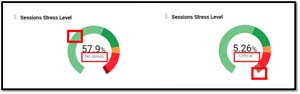
When I pointed to the green no stress critical potion of a widget, it would display more information about it.
 [Click on image for larger view.]
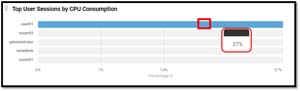
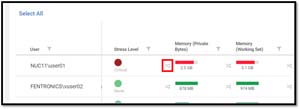
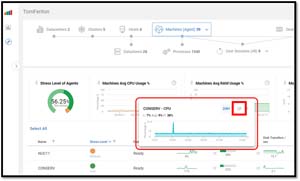
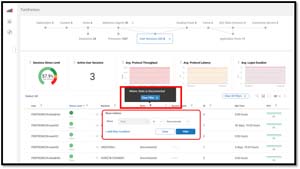
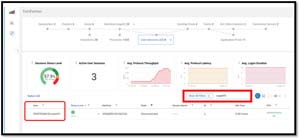
When I clicked an object, it would bring up more information about it. For example, I noticed that one of my user sessions (user01) was consuming an abnormal amount of CPU resources.
 [Click on image for larger view.]
When I clicked the graph, it brought up a page for the user sessions divided into three sections. On the top was a topographical view of my EUC environment; in the middle were widgets showing the aggregate of all the sessions; and on the bottom were the individual sessions.
 [Click on image for larger view.]
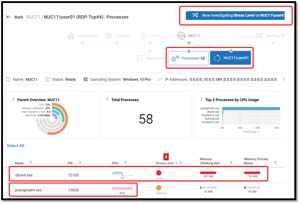
User01's session had a stress level of Critical.
 [Click on image for larger view.]
I clicked the navigation icon to the right of the Stress Level cell. This brought me to a page that displayed the machine (NUC11) and the processes running on it. From here, I was able to immediately identify what was stressing user01's session; one process (OBS) had a very large memory working set, while another (vpengine64) was consuming 99 percent of the CPU's resources.
 [Click on image for larger view.]
By using SOLVE, I was able to identify in just a few clicks which processes were causing the user01 session to be in a critical state.
Historical Data
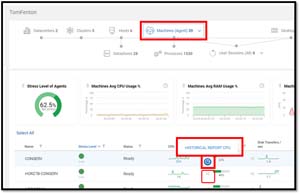
By clicking Machines in the topology view, it listed the machines rather than the user sessions below. When I pointed to the navigation link, a clock icon appeared in some of the cells.
 [Click on image for larger view.]
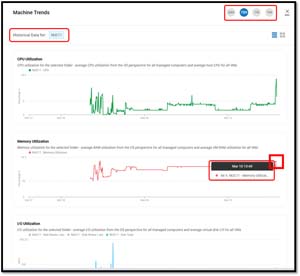
When I clicked the clock icon in the CPU cell, it brought up a window displaying historical data.
 [Click on image for larger view.]
I clicked the expand icon, which displayed multiple historical trends. I could display data for the past month. When I pointed to a particular location, it displayed its time and value.
 [Click on image for larger view.]
I clicked esc in the top right, which brought me back to the Machines view.
Topology View
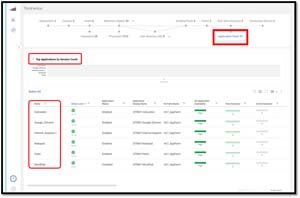
By clicking the different objects is the topology view, I could see different aspects of my environment. I clicked Application Pools, which listed my Horizon-published applications with their metrics in the lower portion.
 [Click on image for larger view.]
I also clicked Desktop Pools, Farms, Connection Servers, Hosts, and User Sessions to display the objects that comprised them in the lower section.
Searching and Filtering Data
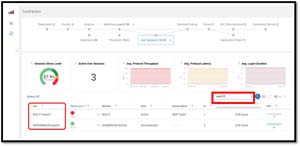
By entering user01 in the Search Grid text box, I was able to limit the display to a single user.
 [Click on image for larger view.]
By clicking the Filter icon, I was able to limit the display to only disconnected sessions.
 [Click on image for larger view.]
I then used the Search function to further limit my search to vuser01.
 [Click on image for larger view.]
Organizational Tree
I cleared my filters and searches, and displayed the organizational tree. I expanded out the tree to display EUC Environment > Horizon 7 Env > Connection Servers. This displayed the health of my connection server.
 [Click on image for larger view.]
I then looked at the health of my desktop pools and farms.
Centralized Auditing
ControlUp also includes the ability to see which actions have been executed on ControlUp and by whom (this information can also be accessed in the audit log). This feature displays the actions for the SOLVE and the ControlUp console. Despite the fact that this feature is in tech preview, I didn't have any issues using it.
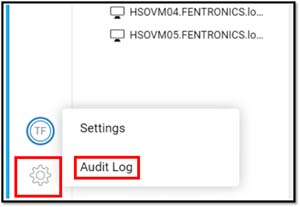
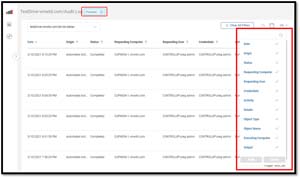
In the lower left corner, I clicked the Gear (settings) icon and selected Audit Log.
 [Click on image for larger view.]
Filters can be applied to the Audit Log to narrow the scope of what is displayed.
 [Click on image for larger view.]
Conclusion
By using SOLVE, I was able to see the status of my environment in real-time, view historical data, and search and filter what was displayed. I was also able to use an organization tree and a topology of my environment to key-in on specific sections of it, and see the actions that users preformed in ControlUp using its Audit Log feature.
In Part 2 of this series, I will take a look at how ControlUp integrated the monitoring of Horizon RDSH in version 8.2 of their product.
(Note: Tom Fenton is a technical marketing manager at ControlUp.)