How-To
Hands-on with ControlUp Edge DX, Part 3: Gathering Metrics & Creating Custom Reports
Tom Fenton concludes his series by creating a script to gather metrics from devices and then creating a custom report from the information gathered.
This is the third article in a series on Edge DX, a program designed by ControlUp to monitor and manage endpoint devices. In the previous articles, I installed the agent on Windows systems (it also supports Linux, IGEL and macOS systems). I used the dashboard to view the metrics on the systems; more specifically, I used it to view the processes that took place during user logon, information which is useful when diagnosing issues with slow logons. I then used it to examine the processes that ran during my Windows sessions.
Not only does Edge DX display metrics from the devices that it monitors, it also lets you create reports and execute scripts on them. In this article, I will create a script to gather metrics from devices and then create a custom report from the information gathered. I will also create an alert that will email me when a system overconsumes resources.
Installing the Agent on a Linux System
In my first article, I explained how easy it is to install the agent on Window systems, but I found installing it on Linux systems to be just as easy if not easier as when you install the agent on a Linux system, you do not need to download the agent to the system. You can just download a script that will automatically get the agent and then install it on the system. The script and instructions on how to use it are on the Downloads page on the Edge DX dashboard.
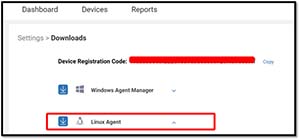 [Click on image for larger view.]
Following these instructions, I was able to install the agent on a device running Fedora that I use as a print server.
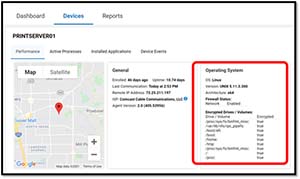 [Click on image for larger view.]
To get an idea of how well the metrics track the resource usage, I ran iperf3 on the print server. The Network Usage widget tracked the increase in network usage.
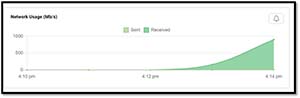 [Click on image for larger view.]
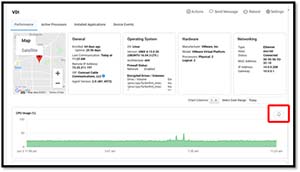
By pointing to the CPU widget, I could confirm which process (iperf3) was consuming the resources.
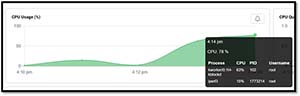 [Click on image for larger view.]
Creating Scripts
You can create scripts in Edge DX by clicking Configuration and selecting Scripts. This will display the scripts that have already been created; or, by clicking Add Script, you can create a new script.
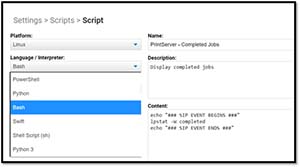
When creating a new script, you have the option of selecting which platform and language to use.
The first script I created was one that ran lpstat -W completed to show the print jobs that had been completed. By encapsulating the command between echo "### SIP EVENT BEGINS ###" and echo "### SIP EVENT ENDS ###" the output displayed under Device Events.
 [Click on image for larger view.]
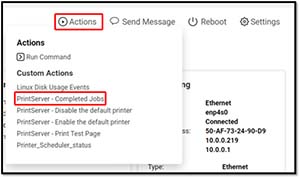
Scripts can either be run manually or by using a trigger. To run the script manually, I selected the print server and then selected the script from the Actions drop-down menu.
 [Click on image for larger view.]
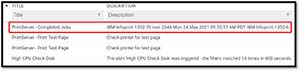
I could then see the output under Device Events.
 [Click on image for larger view.]
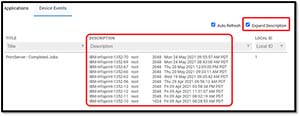
By selecting Expand Description, I could see all the information from the lpstat command.
 [Click on image for larger view.]
Creating a Windows Script
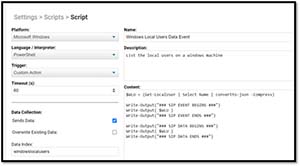
Once I created a Linux script, I wanted to create a Windows PowerShell script that listed the local users on a particular Windows system.
 [Click on image for larger view.]
I encapsulated the output between Write-Output("### SIP DATA BEGINS ###") and Write-Output("### SIP DATA ENDS ###"), selected the Sends Data checkbox, and entered windowslocalusers in the Data Index text box. This wrote the data to Edge DX's database.
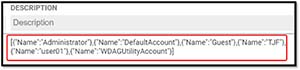
I ran the script, and it displayed the data as expected.
 [Click on image for larger view.]
Creating a Custom Report
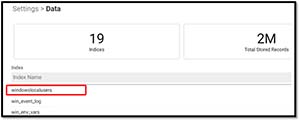
My Windows script wrote the data to the database as well as Device Events. To access the data that was stored in the database, I selected Data from the Configuration drop down-menu and then selected the index that I created.
 [Click on image for larger view.]
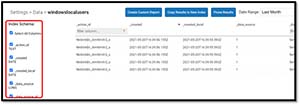
The index schema not only had the information the script requested, but also included metadata such as the time it was created and the machine from where it was derived.
 [Click on image for larger view.]
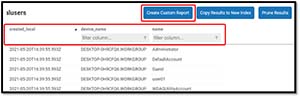
From the index scheme, I selected the checkboxes that contained the information I wanted to display,
 [Click on image for larger view.]
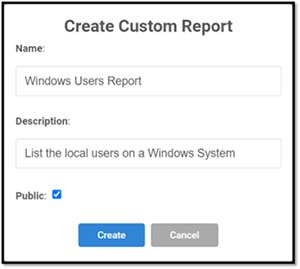
As I wanted to view the information on a regular basis, I selected Create Custom Report. This brought up a box that allowed me to enter a name and description for the report, and then I clicked Create.
 [Click on image for larger view.]
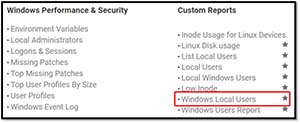
After refreshing the web page, I saw this report as well as the other reports that I had written.
 [Click on image for larger view.]
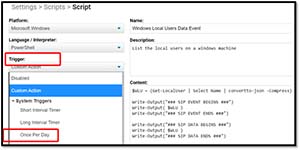
As I wanted to get a list of the local users from all my Windows devices on a regular basis, I went back to the script and, in the left-hand pane, selected Once Per Day from the Trigger drop-down menu. Apart from time schedules, the trigger menu has over two dozen other events that can trigger alerts, such as when a user logs on or off, when a process is started, etc.
 [Click on image for larger view.]
Now, the script I created will collect the users from all the Windows machines and load it into its database every day.
Creating an Alert
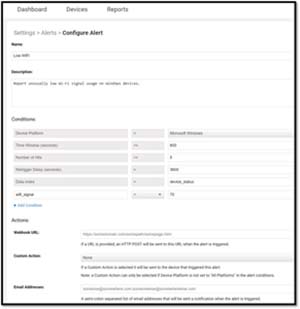
The last feature I wanted to look at in Edge DX was alerts. To access this feature, I selected Alerts from the Configuration drop-down menu and selected Add Alert.
From the Alert Wizard, I created an alert that would email me if the Wi-Fi signal fell below 70 percent. As an added measure, if I wished to do so, I could also have it send a web hook or run a script when the Wi-Fi alert conditions were met.
 [Click on image for larger view.]
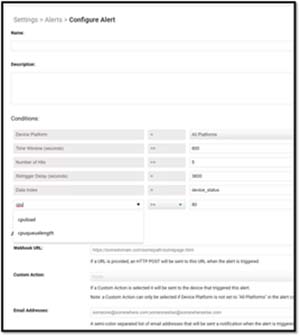
I found that I could also create alerts by selecting the Bell icon on the dashboard.
 [Click on image for larger view.]
This brought up a pre-populated alert wizard that I used to enable an email alert when a device's CPU load rose to over 80 percent.
 [Click on image for larger view.]
Summary
After spending a few weeks using Edge DX, I found it extremely useful for monitoring not only desktops, but also laptops, VDI thin clients, and even a print server. It worked equally as well on both Windows and Linux systems. Over the years, I've found that knowing the health of a device is important, but more important is being alerted when something goes wrong in order to correct it or, even better, to prevent the issue from happening in the first place. By using Edge DX, all of these positive outcomes are possible.
After running a benchmark, I found that the Edge DX had little to no impact on the performance of the device on which it was running.
I liked that Edge DX allowed me to use a wide variety of scripting languages, and that I could create a database index and write data to it -- and then create a report from that stored data. The database was extremely responsive.
Finally, as this is a SaaS application, I didn't need to set up any infrastructure to use it. I simply installed the agent on the devices that I wanted to monitor, and then logged into the dashboard from a web browser.
More information on Edge DX can be found on ControlUp's web site.
(Note: Tom Fenton is a technical marketing manager at ControlUp.)