How-To
Using ntopng Community Edition to Analyze LAN Traffic
In this series of articles, I walked you through how I set up ntopng to monitor my home LAN. I used ntopng because it is a well-respected, powerful, open-source network monitoring tool that has a free Community edition. In my last article on it, I installed it and I could access my ntopng dashboard via a web browser.
If you haven't read my other articles on ntopng, starting here, I recommend doing so as this will give you the background you need to understand this article.
In this article, I will show you how I use ntopng Community edition dashboards to analyze my local LAN network traffic. Although most of the screen captures in this article are from my environment, I took others from the ntopng.org website as they better illustrated the power and capabilities of ntopng.
The ntopng software comes in four versions: Community (free and open source), Professional (for SMEs with additional features such as graphical reports, traffic profiles, and LDAP authentication), Enterprise, and Enterprise bundle, which includes ntopng Enterprise, nProbe Pro, and n2disk. Perpetual licenses are required for ntopng's non-community versions and include one year of updates. For more details, visit: ntopng Versions & Licensing.
Dashboard Overview
My ntopng dashboard was accessed by navigating to http://10.0.0.xx:300 in a web browser, where 10.0.0.xx is the system's IP address where ntopng is running.
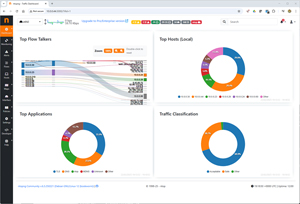
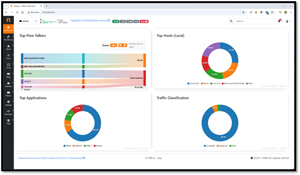
The ntopng home dashboard gave me an overview of my network's status. It allowed me to see real-time traffic data and host activity. A drop-down menu enabled me to select the wired or wireless interface or the system.
I first looked at the wired data.
 [Click on image for larger view.]
I then used the drop-down menu to select the wireless network and examine its data.
 [Click on image for larger view.]
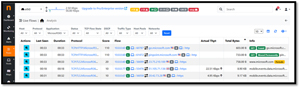
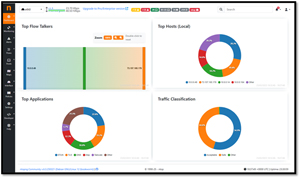
Traffic Flows
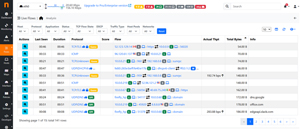
Given ntopng's history, it's no wonder it excels in monitoring and displaying traffic flows. You can see traffic by protocol, application, and even geographical location, providing granular insights.
 [Click on image for larger view.]
You can drill down into a specific host or traffic type, which is useful for identifying issues or unusual patterns.
 [Click on image for larger view.]
As shown in the screen capture above, you can even use ntop to see the network payload.
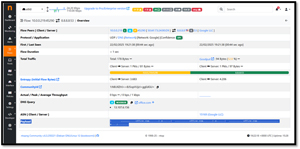
Using the drop-down menu, you can filter by application. When I filtered by Microsoft365, it showed five flows from one of my laptops to Microsoft365.
 [Click on image for larger view.]
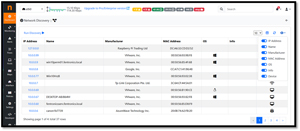
Network Discovery
Like the tools used in my first article in this series of articles, ntopng has a built-in network discovery tool. It lists network devices and traffic. It identifies and catalogs active hosts, IP addresses, MAC addresses, the operating system used, and traffic types. This is useful in detecting new devices, monitoring bandwidth usage, and identifying security threats.
 [Click on image for larger view.]
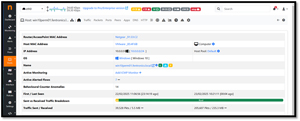
Clicking on the IP address of a device will give you more information about it.
 [Click on image for larger view.]
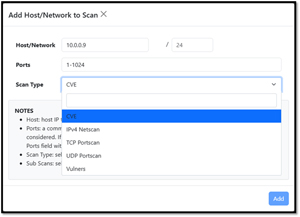
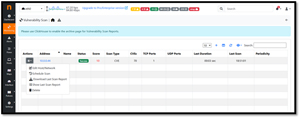
Security Scans
Under the monitoring tab, you can perform security scans on your devices. These scans are designed to enhance network security and monitor potential threats. They actively probe the network to identify vulnerabilities, unusual traffic patterns, and unauthorized devices. By utilizing security scans, administrators can gain insights into potential risks, spot intrusions early, and take proactive measures to safeguard their network infrastructure.
You need to specify the ports to scan and the scan type (CVE, Vulners, etc.) that you want to perform. You can do it for a single host or a range of hosts. If you want to scan just a single host, enter its IP address and use the CIDR notation of 32.
 [Click on image for larger view.]
A scan of the Pi system that I was running ntopng on showed that it had a score of 10, and only one port was open in the 1-1024 range that I scanned.
 [Click on image for larger view.]
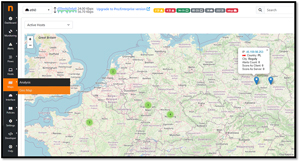
Geolocation
This provides a geographical perspective on network traffic. This tool allowed me to see where network traffic originates and terminates by mapping IP addresses to their physical locations. This can be useful for identifying and analyzing traffic patterns, detecting illegitimate access attempts from unexpected regions, and ensuring compliance with data sovereignty regulations.
 [Click on image for larger view.]
You can click on a location to gather more information about the host in that location. I saw that one host was registered with Microsoft when I clicked on a host in Germany.
 [Click on image for larger view.]
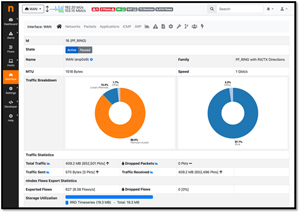
Interface Details
The Interface Details widget in ntopng provides a view of each network interface's status and performance. It includes key metrics such as bandwidth usage, packet statistics, error rates, and traffic composition. This detailed information allowed me to monitor my wired and wireless interface.
 [Click on image for larger view.]
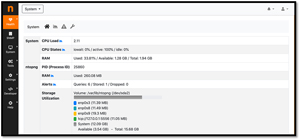
System Information
The System Information widget in ntopng gave me an overview of the Pi resource utilization including CPU usage, memory consumption, disk I/O, and system uptime. This allowed me to monitor the health and resource utilization of the Pi system.
 [Click on image for larger view.]
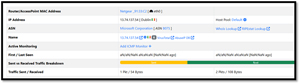
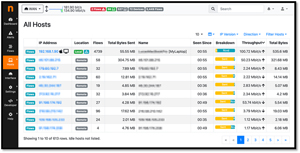
Active Hosts
The Active Hosts widget provided me with an overview of devices connected to my network. It displayed active hosts, their IPs, MAC addresses, and the traffic they generate. It helps spot devices that cause congestion or exhibit suspicious behavior, thus maintaining network performance and security.
 [Click on image for larger view.]
Interesting Insights
When I investigated the flows on my laptop, two popped out. One was my flow to qnap01, which I use to sync the data on my computer for backup purposes. The other was to 2fa4d21b._sub._googlecast._tcp.local, the Chromecast plugin that allows screen sharing if Chromecast-compatible.
 [Click on image for larger view.]
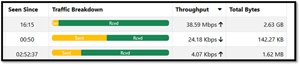
In another case, I transferred a large file over the internet, and the dashboard showed that the file transfer was using up most of the bandwidth.
 [Click on image for larger view.]
Diving deeper, 2.63 GB was transferred over at 38 Mbps.
 [Click on image for larger view.]
Policies
One of the most important features of ntopng is policies, as it can monitor specific rules and regulations for traffic handling and network behavior. Policies enable administrators to set thresholds for bandwidth usage, prioritize certain types of traffic, and enforce security measures. For example, alerts can be generated when an anomalous application is detected. For example, I can set up an alert to notify me when a client uses NFS.
 [Click on image for larger view.]
By implementing these policies, administrators can ensure optimal network performance, prevent congestion, and safeguard against unauthorized access and potential threats. Moreover, policies facilitate automated responses to network anomalies, enhancing overall efficiency and security.
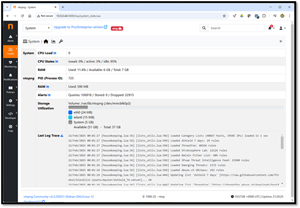
Self-Monitoring
I was worried about whether my Pi system could handle the load of ntopng. ntopng has a system self-monitoring feature that allows you to examine the resource usage of the device on which it runs. This is accessed from the Health tab by selecting System.
 [Click on image for larger view.]
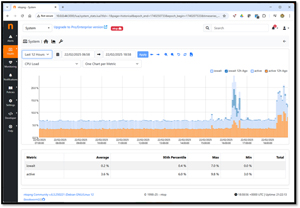
It can even display historical resource usage.
 [Click on image for larger view.]
After examining the data, I felt confident that the Pi could handle the load that ntopng was putting on it.
Going Further with ntopng
I have just touched the surface of the power of ntopng, but fortunately, ntopng.org has a lot of excellent documentation and videos on the use of ntopng.
It needs to be reiterated that I was using the free Community version of ntopng, but the developers also have paid versions to cater to different user needs. The free Community version provided all the features I needed for basic network monitoring and diagnostics. However, the Pro and Enterprise versions have advanced functionalities such as long-term historical data storage, detailed traffic analysis, and complete protocol breakdowns. These versions are designed for more extensive networks and enterprise infrastructures, providing deeper insights, better security monitoring, and comprehensive reporting tools essential for maintaining high network performance and reliability.