How-To
ControlUp Part 3: Advanced Features
Tom Fenton finishes off his series on how to install and use ControlUp, which allows you to troubleshoot and then apply corrective actions to issues that you are having in your vSphere environment. Here, he looks at advanced features he found interesting.
In my first article on ControlUp (located here), I showed you how I installed ControlUp Management Center (CMC) and how I used it to monitor the systems in my vSphere environment. In my second article (located here,) I showed you how I installed the ControlUp Agent (CUA) on a system and then used CMC to monitor and manipulate the processes on the system. After using ControlUp for a few days, I realized that I was only scratching the surface of the power of CMC. In this article, I will show you some of the advanced features of ControlUp that I found most interesting.
CMC Menus
At the bottom of the CMC (Figure 1), there are navigation tabs for different panes and the CMC status bar. The status bar showed the name of the ControlUp organization that I created when I installed the CMC, and confirmed that I was connected to the ControlUp cloud. Above the status bar were the different CMC panes that I could access (Figure 2).
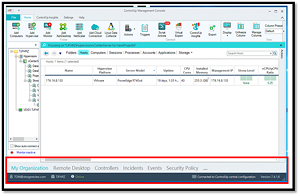 [Click on image for larger view.] Figure 1: CMC
 [Click on image for larger view.] Figure 2: CMC Pane selector
The My Organization pane was the pane that I was using to display information about my host, computers, sessions, etc. The Remote Desktop pane was a remote connection manager that allowed me to set up and switch between RDP sessions.
The Controllers pane (Figure 3) is interesting as it is an advanced management interface which allows you to handle multiple computers in parallel, as well as compare and manage Windows registry, services, file systems, and installed software. For example, if you suspect that one of your systems is misconfigured or is acting strangely, you can compare it to a known good system.
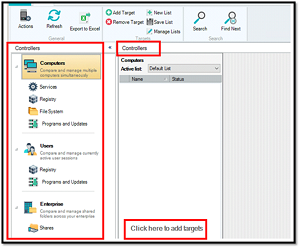 [Click on image for larger view.] Figure 3: Controllers pane
The CMC allows you to set up and review triggers in the Incidents pane which alert you when certain things happen. For example, in Figure 4 you will see that over the last 14 days I have seen some folder and computer stress. For a closer and more specific look, the incidents can be filtered and searched upon.
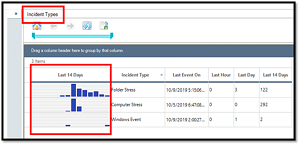 [Click on image for larger view.] Figure 4: Incident pane
Although CMC doesn't do deep log analyses like Splunk or vRealize Log Insight, it does have real-time log aggregation and can display selected events from your connected computer's Windows System, Application and Security event logs; this information can be found in the Events pane (Figure 5).
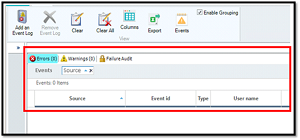 [Click on image for larger view.] Figure 5: Events pane
As noted above, CMC is very powerful and allows you to do deep configuration and manipulation of the computers in your organization. To allow unfettered control to those users who need it (and prevent those who do not), the CMC has a robust role-based access control system (RBAC); you can access its settings from the Security Policy pane (Figure 6).
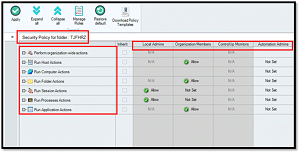 [Click on image for larger view.] Figure 6: Security Policy pane
You can expand each of the roles to expose a fine granular of the actions (Figure 7) that can be controlled for the CMC users. By using this feature, you could endow a user to only be able to view the processes of the virtual desktop in a VMware Horizon desktop pool or other logical groups of systems.
 [Click on image for larger view.] Figure 7: Actions
I found that I could carry out most of my day-to-day CMC activities from the My Organization pane. As noted in my previous articles, you can see a plethora of metrics about the systems you are monitoring from this pane, as well as perform advanced system management tasks. Each of the different views (e.g., Folders, Hosts, Computers, etc.) has different management functions that can be performed on the objects in the pane. I will use the Computers view to show some of the power of the CMC.
One of the things that caught me up a little is that there are two different ways to access the advanced features of an object: by clicking on the sandwich icon (the three vertical lines), or by right-clicking in the cell.
By clicking on the sandwich (
Figure 8), I found that I could run scripts against that object, and these scripts are specific for that type of object. You can even open a VMware remote console to systems that have VMware tools installed on them.
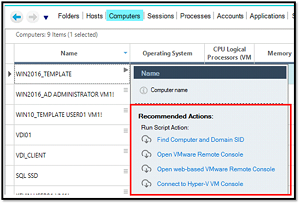 [Click on image for larger view.] Figure 8: Recommended actions
I also found that right-clicking an object gave me even more options (Figure 9). When I clicked a VM running on vSphere, I had the option to perform vSphere-specific functions, ranging from working with snapshots to reconfiguring the VM's hardware. Many of these functions require ControlUp scripts, and if the script is not already on the system, it will fetch and install it on your system.
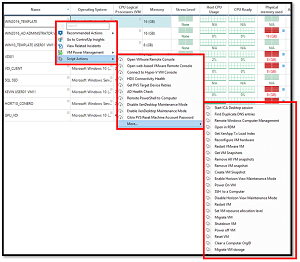 [Click on image for larger view.] Figure 9: Right-clicking object
Wrapping Up
I found that working with CMC was like unpeeling an onion: the more I worked with it, the more layers and features I found within. I liked how the CMC let me intuitively explore my system and then dive in on specific objects of my choosing. Although I am at the point where, after two short weeks of occasional use it has become an indispensable tool for me, I know that there are even more features and functions to discover, and I'm looking forward to exploring those as they arise.
(Note: Tom Fenton is a technical marketing manager at ControlUp.)
About the Author
Tom Fenton has a wealth of hands-on IT experience gained over the past 30 years in a variety of technologies, with the past 20 years focusing on virtualization and storage. He previously worked as a Technical Marketing Manager for ControlUp. He also previously worked at VMware in Staff and Senior level positions. He has also worked as a Senior Validation Engineer with The Taneja Group, where he headed the Validation Service Lab and was instrumental in starting up its vSphere Virtual Volumes practice. He's on X @vDoppler.