How-To
Using AWS CloudWatch to Monitor Your EBS Volumes
Brien Posey explains how to keep tabs on your AWS storage usage, one of the biggest factors affecting EC2 virtual machine performance.
Storage usage is one of the things that has the biggest impact on an EC2 virtual machine instance's performance. If an instance's storage is being over exerted, then virtual machine performance will suffer. Thankfully, Amazon provides an easy way to keep tabs on EC2 instance storage.
By default, EC2 instances use Elastic Block storage (EBS). There is normally a dedicated EBS volume for each instance. You can set up CloudWatch to alert you to conditions in which the EBS volume is having trouble keeping pace with the demand.
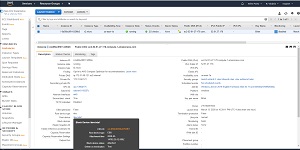
The first step in this process is to figure out which EBS volume is mapped to the instance that you want to monitor. To do so, open the EC2 dashboard and select the instances tab. Next, select the instance of interest and then take a look at the Description tab located beneath the list of instances (see Figure 1). This tab provides listings for the Root Device and Block Devices. Normally, these devices will be set to /dev/sda1 or something similar. However, this isn't the name of the EBS volume.
 [Click on image for larger view.]
Figure 1: The Description tab lists the selected instance's root device and block devices.
[Click on image for larger view.]
Figure 1: The Description tab lists the selected instance's root device and block devices.
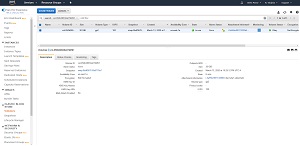
As you look at Figure 1, you will notice that the root device and the block devices (which are one in the same in this case) are hyperlinked. If you click on this hyperlink you will see a pop-up displaying additional information about the device. The EBS volume name is listed as the EBS ID, as shown in Figure 2.
 [Click on image for larger view.]
Figure 2: The EBS ID field displays the EBS volume name.
[Click on image for larger view.]
Figure 2: The EBS ID field displays the EBS volume name.
While you could make note of the volume name and then manually navigate to the EBS tab, the easier option is to simply click on the volume name. This will take you directly to the list of EBS volumes and the volume that you clicked on will be selected, as shown in Figure 3.
 [Click on image for larger view.]
Figure 3: Clicking on the volume name will take you to the volume's listing on the Volumes tab.
[Click on image for larger view.]
Figure 3: Clicking on the volume name will take you to the volume's listing on the Volumes tab.
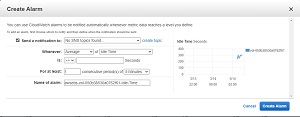
As you can see in the figure above, there are several tabs listed beneath the volume (Description, Status Checks, Monitoring, and Tags). The option to configure a CloudWatch alarm is located on the Monitoring tab. Simply go to the Monitoring tab, and then click on the Create Alarms button. When you do, AWS will display the Create Alarm dialog box shown in Figure 4.
 [Click on image for larger view.]
Figure 4: This is the dialog box used to create an alarm.
[Click on image for larger view.]
Figure 4: This is the dialog box used to create an alarm.
The first step in the process of creating an alarm is to choose where the notification will be sent. You will notice in Figure 4 that the Send a Notification to option currently says No SNS Topics Found. The reason for this is that I have not previously created an alarm. To fix this problem, click the Create Topic link. Now you are free to enter a topic name and a recipient.
The topic name is used for descriptive purposes, and can be up to 256 characters in length. Recipients are specified by their email address.
The next step in the process is to set the alarm trigger. In Figure 4, the alarm is triggered when the average amount of idle time is greater than or equal to a value that you specify. In the real world though, it is more common to use options that watch for a performance problem. You might for instance trigger an alarm based on the disk queue length or the read or write bandwidth.
In addition to setting the alarm trigger, you will also need to specify a threshold value. In most cases, you probably don't want to trigger an alarm if an activity spike happens to hit your threshold value for a brief moment. It's usually better to look at sustained levels of activity. In Figure 4 for example, the alarm trigger was based on an average value and that average has to extend for a period of at least five minutes. Examining averages over a period of time helps to avoid having an excessive number of alarms.
One last thing that I want to point out is the chart on the right side of the window. This chart shows the most recent metrics for the performance metric that you have chosen. The information shown on the chart can help you to choose an appropriate threshold value for your alarm.
About the Author
Brien Posey is a 22-time Microsoft MVP with decades of IT experience. As a freelance writer, Posey has written thousands of articles and contributed to several dozen books on a wide variety of IT topics. Prior to going freelance, Posey was a CIO for a national chain of hospitals and health care facilities. He has also served as a network administrator for some of the country's largest insurance companies and for the Department of Defense at Fort Knox. In addition to his continued work in IT, Posey has spent the last several years actively training as a commercial scientist-astronaut candidate in preparation to fly on a mission to study polar mesospheric clouds from space. You can follow his spaceflight training on his Web site.