How-To
Getting Started with AWS Elastic Beanstalk, Part 2: Behind the Scenes
In the previous article in this series, I walked you through the process of creating an application in AWS Elastic Beanstalk. Now, I want to take a step back and show you what really happens behind the scenes when you set up a new application.
When you create a new Elastic Beanstalk application, the creation process causes a screen similar to the one that is shown in Figure 1 to be displayed. The specific elements on the screen are probably going to vary by application platform, but you can at least use the screen to gain a bit of insight as to how Elastic Beanstalk works. In this case, for example, Elastic Beanstalk has created several CloudWatch alarms, an auto scaling group and an EC2 instance.
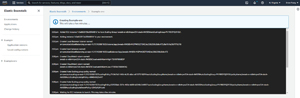 [Click on image for larger view.] Figure 1: This screen is shown while an application is being created.
Once the process completes, the screen shown above will disappear and you will be taken to a screen like the one shown in Figure 2. This screen shows you the overall health of your Elastic Beanstalk application, the platform that it is running on and any recent events that might have occurred. You can also access this same information by opening Elastic Beanstalk, selecting the Environments tab and then clicking on your application.
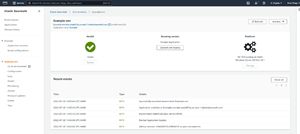 [Click on image for larger view.] Figure 2: This screen displays your application's health.
Now that the new application is up and running and is shown to be healthy, the next thing that you would probably want to do is to make sure that the application is accessible and that it is working as intended. Elastic Beanstalk is intended for use with web applications, so not surprisingly your application is available through a URL. If you look back at the previous figure, you will notice that a URL is being displayed just above the big green checkmark icon. Clicking on this URL causes a new browser tab to open and causes your application to be displayed. For the purposes of this article, I opted to use the sample application so clicking on the link takes me to a page saying "Congratulations! Your AWS Elastic Beanstalk ASP.NET application is now running on your own dedicated environment in the AWS cloud." Had I created a "real" application, that would have been displayed instead.
 [Click on image for larger view.] Figure 3: This is what the sample application looks like.
As I explained in the first part of this article series, the whole point of using Elastic Beanstalk is that it allows your application to scale to accommodate demand. That being the case, you may be curious as to how much of a load is being placed on your application at a given moment.
If you look back at Figure 2, you will notice that there are a series of tabs on the left side of the screen and that these tabs allow you to access things like the environment's logs, health information, alarms, events and that sort of thing. If you want to know about the application's workload, then click on the Monitoring tab. This will cause the console to display a series of performance charts, similar to what you see in Figure 4.
 [Click on image for larger view.] Figure 4: Click the Monitoring tab to access the application's performance metrics.
The most important thing to pay attention to as you examine this chart is that the periods of time reflected by the various chart items are not consistent. The top portion of the screen contains an overview chart, which displays things like the number of healthy hosts, the target response time and the sum requests. The period for this overview chart is one hour, although you can set it to as little as one minute or as much as a day.
There are also a series of graphs that are displayed beneath the Overview chart. Whereas the Overview chart defaults to a period of an hour, however, the Monitoring graphs default to a period of three hours. In other words, the information shown in the Overview chart might not always correlate with the information in the Monitoring graph because the periods are different.
One last thing that you need to know about Elastic Beanstalk environments is that even though your application is running within a managed environment, there is always the chance that you may run into a problem. If that happens, you can simply rebuild the environment. If you look back at Figure 2, you will notice that there is an Actions button in the upper right corner. Clicking on this button exposes a menu that gives you options such as restarting the app sever, rebuilding the environment or even terminating the environment.
About the Author
Brien Posey is a 22-time Microsoft MVP with decades of IT experience. As a freelance writer, Posey has written thousands of articles and contributed to several dozen books on a wide variety of IT topics. Prior to going freelance, Posey was a CIO for a national chain of hospitals and health care facilities. He has also served as a network administrator for some of the country's largest insurance companies and for the Department of Defense at Fort Knox. In addition to his continued work in IT, Posey has spent the last several years actively training as a commercial scientist-astronaut candidate in preparation to fly on a mission to study polar mesospheric clouds from space. You can follow his spaceflight training on his Web site.