In-Depth
Going Carbon-Neutral? Microsoft Has a Tool for That
From Microsoft's "sustainability cloud" to multiple Microsoft 365 emissions dashboards, there are plenty of tools available to businesses to start measuring -- and reducing -- their carbon footprints.
Microsoft is taking "going green" seriously, with a very ambitious goal of being carbon-neutral by 2030 and completely removing all the carbon it has ever emitted directly or through electricity use by 2050.
But did you know that it also offers several tools to help your business get a handle on your organization's carbon footprint? In this article, we'll look at these tools, how to get started with them, show what they do and how they work together, and why you should care. After all, you can't manage what you can't measure, and you need automation to measure at scale.
Depending on where you are, the industry your organization is in and what regulations you have to comply with, it's either a good idea or a requirement to start getting a handle on your total greenhouse gas impact as a business.
Emissions Concepts
A few terms will help you understand how greenhouse gas emissions are measured and the different aspects you need to take into account. The Greenhouse Gas Protocol is the basis in Microsoft's tools, where Scope 1 relates to direct emissions from stationary and mobile combustion and other processes (i.e., your organization is directly generating it by what you're doing). Scope 2 relates to indirect emissions; you consume electricity (or heat or steam) generated by another organization, and since you bought it from them, you're responsible for the greenhouse gases generated. These two are relatively easy to understand, if not always easy to measure, but at least they're more in your control.
Scope 3 relates to other indirect emissions as part of your supply chain. The Microsoft 365 Emissions Dashboard (see below) tracks categories 1, 2, 4, 5, 9 and 12. This month Microsoft also added categories 5, 8 and 13. There are a total of 15 categories:
- Purchased goods and services
- Capital goods
- Fuel- and energy-related activities
- Upstream transportation and distribution
- Waste generated in operations
- Business travel
- Employee commuting
- Upstream leased assets
- Downstream transportation and distribution
- Processing of sold products
- Use of sold products
- End-of-life treatment of sold products
- Downstream leased assets
- Franchises
- Investments
Carbon Intensity is a common sustainability term, relating to the ratio between emissions and another variable. In the case of the dashboards (see below), it measures grams of CO2e (carbon dioxide equivalent) per user.
Emissions Impact Dashboards
There are two Power BI apps that we're going to look at first – one for tracking your carbon emissions owing to your Azure usage, and one for your Microsoft 365 usage. The apps themselves are free, but you'll need Power BI Pro (which many businesses already have) to use them. There's also a 60-day trial available.
I set this up for one of my clients. They have about 125 users using Microsoft 365 for e-mail, collaboration, file sharing and security. When you first install it, it is populated with demo data, but when you connect your tenant as an OData source and wait for about 48 hours, it populates with your data.
 [Click on image for larger view.] Figure 1. Connecting the Emissions Dashboard to your tenant.
 [Click on image for larger view.] Figure 2. Microsoft 365 Emissions Impact Dashboard overview.
As you can see, it shows the data going back 12 months, with a large dip in Scopes 2 and 3 emissions per month in December 2021/January 2022 (which comprise the summer holidays for this school here in Australia).
The tab called Calculation Methodology in the Dashboard outlines what Scopes 1, 2 and 3 are, as well as how Microsoft calculates your usage and apportions the overall emissions across different Microsoft 365/Azure regions to your tenant.
 [Click on image for larger view.] Figure 3. Calculation Methodology in the dashboard.
Note that the dashboard only considers Exchange Online, SharePoint, OneDrive for Business, Teams, Word, Excel, PowerPoint and Outlook usage.
The Carbon Intensity tab shows active users per month. In my client's case, it calculates 278 grams per user in the most recent month. This is equivalent to driving .7 miles (1.1 Km) or charging 35 smartphones.
The Emissions Savings tab estimates how much greenhouse gas you're not emitting by using a multitenant, highly efficient hosted service -- in some of the most power-efficient datacenters on the planet -- compared to running Exchange and SharePoint on-premises. There are three options to compare: low-efficiency (physical servers with direct attached storage in a small datacenter), medium-efficiency (a mix of physical and virtual servers in a mid-tier datacenter) and high-efficiency (virtualized servers and dedicated storage in a high-end datacenter). The last time this school had their own Exchange Server was over five years ago, but we've had virtual servers for many years, so compared to a medium-efficiency alternative, we've saved 1.5 metric tons of CO2 (the equivalent of driving a car 3.7 million miles) this year alone.
 [Click on image for larger view.] Figure 4. Emissions savings.
The Power BI app for Azure is very similar but is instead based on your Azure usage. It replaces the Microsoft Sustainability Calculator released back in 2020. My client has Microsoft Sentinel deployed, but no other Azure workloads (yet) so I expect very few emissions to be shown.
 [Click on image for larger view.] Figure 5. Azure Emissions Impact Dashboard.
Any organization's overall CO2 emissions will come from a lot more than Microsoft 365 and Azure usage, however, and this is where a new tool released in June 2022 -- the Microsoft Sustainability Manager -- comes into play.
Microsoft Sustainability Manager
This is a Power App and builds on top of the data model created in Azure in Microsoft's Cloud for Sustainability (see below). United Kingdom and APAC deployment regions became available in November 2022.
This is a single app to track all of your emissions to help you record, report and reduce your organization's emissions and comes with a 30-day trial (it's $4,000 per month after that -- not exactly SMB-friendly pricing).
Like the emissions dashboards (which both feed into this tool if you're using them), this tool comes with pre-populated demo data and a link to a configuration guide to help you set it up.
 [Click on image for larger view.] Figure 6. Microsoft Sustainability Manager configuration guide.
This app is much more comprehensive than the two previous dashboards and much more flexible. Underneath it is the common data model for sustainability data in the dataverse, which is the data storage service underneath all Power Apps.
There's a fair bit more work here for you to do to connect data sources and model your business, but if you're serious about understanding your organization's total CO2 emissions, being able to report it to relevant regulatory bodies and, most importantly, seeing where you can make changes to lower your emissions, this is a good tool. It's easy to model the impacts to your bottom line of changing electricity supply to one based on renewable energy or swapping delivery services to ones using electric vehicles.
Microsoft Cloud for Sustainability
Finally, we get to the title of this article – just like Microsoft has a cloud for health care, one for manufacturing and so on, this "sustainability" term doesn't refer to a different set of datacenters or different servers in Azure, but rather a set of services specifically aimed at a vertical. Unlike all the others, Cloud for Sustainability goes across all verticals and encompasses several different services.
 [Click on image for larger view.] Figure 7. Microsoft Cloud for Sustainability (courtesy of Microsoft).
We've already covered the two dashboards in Power BI and Sustainability Manager, while the Environmental Credit Service uses blockchain to tag credits produced by different suppliers, which you can then incorporate in your models. These, and all the underlying data in Sustainability Manager (just like Microsoft's own sustainability reporting), are verified by an independent third-party organization.
There's also a free (authenticated) API available. Today it gives you access to the same information as the Azure Emissions Impact dashboard, but in the future, other Microsoft workloads will also be included. This means you can build your own reports and visualizations in your tool of choice. Note the empty grey box in the diagram above; the presenters at Microsoft Ignite 2022 were careful to point out that more services were coming.
In the cloud solutions center there are several options presented. Apart from the ones already mentioned, there are LinkedIn learning and Microsoft Learn modules available for further insight.
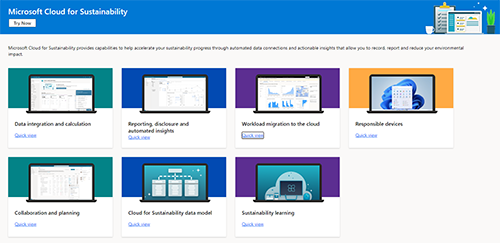 [Click on image for larger view.] Figure 8. Microsoft Cloud for Sustainability solutions.
There's an Insider program where you can get access to private previews in the Sustainability Cloud and participate in a private Yammer community.
Coming March 2023
Another very important measure is water usage, as the warming planet causes more water scarcity in various regions. This capability is coming to Sustainability Manager. Scope 3, category 7 (employee commuting) and category 12 (end-of-life treatment of sold products) are also being added. Smart facilities data that report electricity usage using sensors will be able to be ingested more easily. There's also AI support coming early next year.
The whole roadmap of the next wave is available here.
Microsoft also has several partners in this space because, obviously, this isn't something that Microsoft can do all by itself.
There's no regulation yet in Australia (for my clients) demanding this information, but I'm going to demo the dashboards to my clients to see what their interest is. I'll leave you with some inspiring case studies that I watched when researching this article, including this one from my native country of Sweden and this one about Ingredion.
Is measuring your business CO2 emissions something you're already doing, or something you want to start doing? Let me know @Paulschnack.