How-To
Creating Security Profiles for IoT Devices
One of the big advantages to using AWS as a management platform for your IoT devices is that you can create security profiles that are able to generate alerts in response to conditions that might indicate a security issue.
In a recent blog post, I explained how to deploy an agent to an IoT device, which would allow the device to communicate with AWS. One of the big advantages to using AWS as a management platform for your IoT devices is that you can create security profiles that are able to generate alerts in response to conditions that might indicate a security issue. In this blog post, I will show you how to create a security profile for your devices.
Before I get started, I need to point out that this blog post assumes that you have already connected one or more IoT devices to AWS. If you haven't, and you need some help, then be sure to check out my other blog post.
So with that said, open the AWS IoT console, expand the Detect container, and click on the Alarms tab. When you do, you will see a screen prompting you to create your first security profile. Click the Create Your First Security Profile button and you will be asked if you want to create a machine learning (ML) anomaly detect profile or if you would rather create a rule based anomaly detect profile. You can see what this looks like in Figure 1. For the purposes of this blog post, I will be creating a ML anomaly detect profile, which you can see in Figure 2.
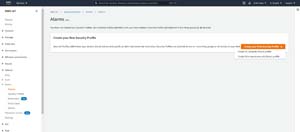 [Click on image for larger view.] Figure 1: Choose the type of anomaly detect profile that you want to create.
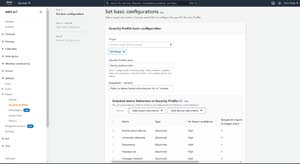 [Click on image for larger view.] Figure 2: You can use this screen to create an ML anomaly detect profile.
The first thing that you will need to do is to choose the devices that the profile will apply to. You won't be able to select individual devices, but you can choose one or more device groups. If you haven't organized your devices into groups, then another option is to choose All Things.
Next, you will need to enter a name for the security profile that you are creating, along with an optional description. The description should convey what the policy does or why it was created.
The next step in the process is to choose the metrics that you want to include in the policy. You can create a policy that is based on a single metric, but you can also bundle multiple metrics into a single policy.
If you look back at the previous figure, you will notice buttons used to add cloud-side metrics and to add device-side metrics. Most of the cloud-side metrics are included in the policy by default, but you can remove metrics by selecting them and clicking the Delete button. To add device-side metrics, just click on the Add Device-Side Metric button and then choose the metrics that you want to add from the dropdown menu. Keep adding and deleting metrics until your policy contains only the metrics that you want to include.
Although it is cut off in the screen capture, the Set Basic Configurations screen also contains an option to create an SNS topic for alerts that are generated.
When you are done, click Next, and you will be taken to the Edit Metric Behaviors screen. If you are creating an ML anomaly detect profile, you won't generally have to worry about editing metric behaviors. However, the Edit Metric Behaviors screen allows you to make changes to the metrics' behavior if necessary. For example, you might want to change the ML detect confidence level to a lower value or turn off the suppression of notifications. You can see what this screen looks like in Figure 3.
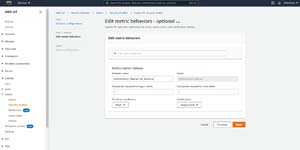 [Click on image for larger view.] Figure 3: You can customize the behavior of any metrics that you have included in the policy.
Click Next, and you will be taken to the Review Configuration screen. Take a moment to make sure that the information presented on this screen is correct and then click the Create ML Security Policy button, shown in Figure 4.
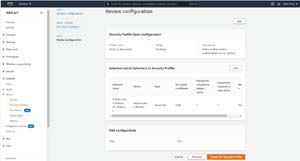 [Click on image for larger view.] Figure 4: Make sure that the metrics are configured correctly and then click the Create ML Security Profile button.
When you are done, you will see the new profile listed on the Security Profiles screen, as shown in Figure 5.
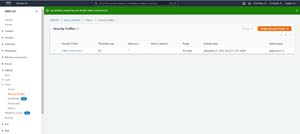 [Click on image for larger view.] Figure 5: The new security profile has been created.
If the security policy triggers an alarm, that alarm will be displayed within the Alarms tab, shown in Figure 6. This tab shows which thing (IoT device) triggered the alarm, the security profile that detected the event, the behavior state and the verification state. Verification states are used to classify alarms. For example, you might classify an alarm as a false positive or as benign. This classification can help the security staff to know which alarms need to be investigated further.
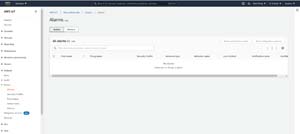 [Click on image for larger view.] Figure 6: Alarms are displayed on the Alarms tab.
About the Author
Brien Posey is a 22-time Microsoft MVP with decades of IT experience. As a freelance writer, Posey has written thousands of articles and contributed to several dozen books on a wide variety of IT topics. Prior to going freelance, Posey was a CIO for a national chain of hospitals and health care facilities. He has also served as a network administrator for some of the country's largest insurance companies and for the Department of Defense at Fort Knox. In addition to his continued work in IT, Posey has spent the last several years actively training as a commercial scientist-astronaut candidate in preparation to fly on a mission to study polar mesospheric clouds from space. You can follow his spaceflight training on his Web site.