In-Depth
Fine-Tune Defender XDR for Cost and Coverage
One of the greatest challenges when you're a cyber defender is making sure you've covered all the potential attack vectors. If you're part of a large security team at an enterprise you probably have engineers and architects dedicated to this task, but for the rest of us, this is an ongoing challenge. After all:
"Defenders have to be right every time. Attackers only need to be right once."
Which is known at the defender's dilemma. I happen to disagree with this statement, primarily because attackers actually have to get it right at every step of their attack, providing us defenders with multiple opportunities to detect and hopefully stop or deter them. However, we do have to make sure we have coverage in our detections for the potential avenues into our infrastructure so that we can spot them.
I'm managing the IT and cyber security for a small handful of clients, using Microsoft Defender XDR and Sentinel to do so. In this article I'll look at a new(-ish) service called SOC optimization and how it fits into both ensuring you are collecting the right logs and data, using it to detect badness, but not collecting logs that are costing you money while not actually providing security value.
I'll also look at two workbooks in Sentinel that can be used to optimize your usage and understand costs.
Show Me My Gaps
Here's the Overview tab in SOC optimization in one of my client's production tenants.
 [Click on image for larger, animated GIF view.] Overview Tab in Action
It's available in both the unified SOC experience at https://security.microsoft.com/ as well as in the legacy Sentinel portal in Azure. It covers both the XDR suite (Defender for -Office 365, -Endpoint, -Identity and -Cloud Apps) and Sentinel.
Here we can see an ingestion rate of about 25 GB per month, with a small dip in September (when they were on school holiday) and 12 active optimizations, two dismissed and 39 completed. I can then see the optimization for "Coverage improvement against AiTM (Adversary in the Middle)" as an example, which incidentally was the topic of my article last month (based on an attack at a different client). It's suggesting that I improve my coverage against AitM from Medium to High -- clicking on View full details I get:
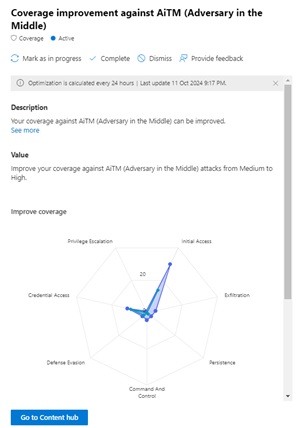 [Click on image for larger view.] Coverage Improvements Against AitM
With the map showing me that I already have some rules covering Credential Access and Initial Access, they suggest 10 more rules in those and other areas would give me better coverage. Clicking Go to Content hub brings me to a filtered view of 21 rules that are suggested (including 2 that are already in use). However, they all rely on data sources (Fortinet, CloudFlare, Trend Micro etc.) that I don't have in this environment so instead I picked Coverage improvements against BEC (Financial Fraud) which has eight rules, two of which are already in use, with one example additional rule highlighted:
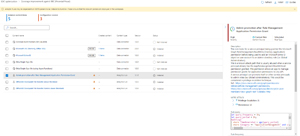 [Click on image for larger view.] Suggested Rule for Coverage Improvements Against BEC
By clicking on it from here I can then create an analytics rule based on the template and within 24 hours the engine behind SOC optimization will recognize this new rule and track it in the different optimizations where it applies.
The suggestions for analytics rule templates to install and enable are based on the Content hub which contains all the rules (and connectors) that Microsoft creates, as well as third-party connectors and rules created by others in the industry.
There are cards in SOC optimization for AitM, BEC and Human Operated Ransomware coverage optimizations. I then have Data value cards for Low usage or no usage of various tables where low indicates that there are no analytics rules (Sentinel) or custom detections (XDR) running against a table, whereas no usage shows it's also not being used in queries or workbooks (visualizations).
The coverage analysis is based on the MITRE ATT&CK Enterprise framework, which is a common language for cyber security, defining Tactics, Techniques and Procedures (TTPs) in the different phases of attacks.
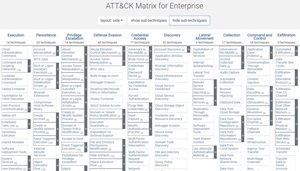 [Click on image for larger view.] ATT&CK Matrix for Enterprise
I can also see the optimizations that I have completed on a tab, as well as ones that have been dismissed, in this case ERP (SAP) Financial Process and IaaS Resource Theft, which aren't applicable to this client.
SOC optimization will also suggest additional data sources if there's a gap where particular logs aren't being collected. In addition it will spotlight if you are ingesting custom log sources but have no analytics rules detecting against them.
Upcoming features which haven't surfaced in this public preview yet are comparisons of your coverage (data sources and analytics rules) with other organizations in your industry and of your size.
Overall, I find SOC optimization a very useful starting point -- quickly leading me to enable rules that I have missed, and taking a good look at the data collected to make sure it's actually being used for security improvements. However, it's a little jarring to be presented with a list of 20-plus rules that would help this client be more secure, only to realize that they rely on products / services and connectors that aren't in this tenant. I'd like the connected log sources to be considered by the Machine Learning engine behind the scenes in future versions.
 [Click on image for larger view.] Low Usage of IdentityLogonEvents Table
Next I'm looking at the IdentityLogonEvents table, which has low usage, I can clock Go to Content Hub to see the analytics rules that take advantage of this table, in this case Detect Potential Kerberoast Activities. This is an attack where an Active Directory user account has been compromised, and the attacker requests a Kerberos service ticket from AD, which will be encrypted with a hashed version of the Ticket Granting Service's (TGS) password. This ticket is then copied offline, and the attacker brute-forces the hash to obtain the plain-text password, which can then be used to further escalate privileges.
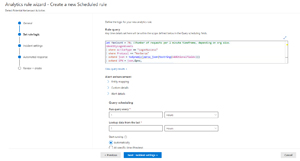 [Click on image for larger view.] Creating a New Analytics Rule to Detect Kerberoast Activity
Both the fact that this table wasn't used and that I didn't have a detection for Kerberoast at this client were surprises for me, so I'm glad that SOC optimization showed me this.
Next up is a table that wasn't queried and doesn't have any out of the box analytics rules related to it, Perf, which has performance data in it (mostly from DNS after a quick look). There's a handy Archive table button right there which takes me to the Log Analytics workspace table settings where I can change the retention period to save some money for my client.
Next, for Sentinel specifically I'd like to highlight two more helpful workbooks.
Workbooks Provide a Great Overview
Workbooks in Sentinel are visualization tools that are built on KQL queries against the underlying log data. There are many provided by third parties for their particular cyber security solutions, along with numerous from Microsoft themselves, plus several from the community. This first one, the Microsoft Sentinel Optimization Workbook, has four tabs, with the first one showing Cost and Ingestion Optimization. First it provides an overview over the last 30 days (you can change this to be between the last 5 minutes, up to 90 days), with total billable ingestion, trends, pricing plans, and the top ingestion table. Underneath the summary are breakouts with more details on each of these areas.
 [Click on image for larger view.] Microsoft Sentinel Optimization Workbook - Cost and Ingestion
The Operational Optimization and Effectiveness tab tracks incident severity, mean time to respond, average time to closure, automation usage and more. The Management and Acceleration tab shows the overall workspace retention, watchlists, Threat Intelligence (TI) indicators ingested and statistics for analytics rules. I really like the breakdown of the individual tables, their size, retention and the split of time between interactive and archived state.
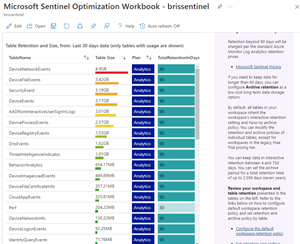 [Click on image for larger view.] Microsoft Sentinel Optimization Workbook - Table Retention and Size
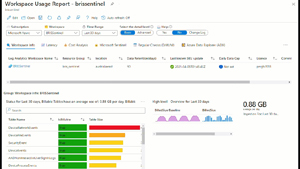
The Workspace Usage Report is in the second workbook and it has much of the same data as the Optimization workbook but broken down slightly differently and relying more on colors and visualizations to convey the information.
 [Click on image for larger view.] Workspace Usage Report
The Latency tab shows the ingestion latency for each table, plus explanations for the data each table contains.
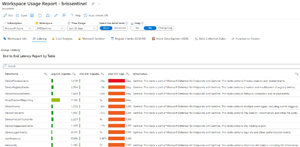 [Click on image for larger view.] Workspace Usage Report Latency Tab
The Cost Analysis tab goes into great detail of all the costs associated with ingestion of log data, and retention, with breakdowns for each table, plus data on Syslog and Common Security Format (CEF) ingestion if used.
The Microsoft Sentinel tab looks at anomalies in data ingestion, WatchList (data that you can import into Sentinel such as lists of high value servers, or user accounts for example), TI ingestion broken down by type and time as well as the ability to select a Solution installed from the Content hub and see the tables and data generated by that solution, which can be very helpful when trying to figure out why a particular table has grown for example.
The Daily / Weekly and Monthly tab provides a list of regular tasks to perform to keep your Sentinel workspace tuned and efficient. There are also tabs for Azure Data Explorer (ADX) if you're exporting data there, Data Collection Rules and Functions or Parsers, none of which are in use at this client.
Overall, this workbook is the more comprehensive investigation tool of the two and for me it's a great help to understand the relationship between data ingested, cost, table sizes and much more.
Conclusion
I suspect the SOC optimization feature will become generally available soon, possibly at the upcoming Ignite 2024. I think it's a very helpful feature for a time-poor one-person SOC operator, but it's also useful in larger environments, at least as a starting point for discussions with the business. The two workbooks I covered are also useful in digging into the often opaque foundation of Sentinel in logs and data sources.