Master Monitor
Keep an eye on all your systems with this one handy product.
Server sprawl has been an issue since commodity servers came along. With virtual servers it can be even more of an issue, however, because one hypervisor can host many servers, and keeping track of whether they're on or off -- and whether the applications they're supposed to be running are actually available -- can be even more difficult. Management apps such as VMware vCenter and Microsoft System Center Operations Manager provide some management tools as well as monitoring, but have their limitations, including a limited ability to monitor anything other than VMware or Microsoft products, respectively, and pricing that can escalate quickly with many servers.
AccelOps All-in-One is a monitoring tool that can monitor many devices and servers in addition to VMware (with Xen and Hyper-V monitoring coming soon), and the license limits are based on the number of nodes and respective events per second rather than the number of servers and applications [1]. AccelOps All-in-One is not a replacement for vCenter or Microsoft Operations Manager, but a complementary tool that can find and monitor VMware servers and virtual machines (VMs), as well as many other types of network nodes.
Watch over Everything
AccelOps All-in-One doesn't do management -- it's strictly for monitoring and alerts -- but it can monitor a vast array of systems, including operating systems, anti-virus products, firewalls, routers, switches, wireless access points, VPN gateways, storage systems, intrusion prevention/detection systems, e-mail security products, directory services, DNS and DHCP servers, databases, Web servers, terminal servers, vulnerability scanners and, of course, VMware servers. Its biggest advantage is the ability to parse the enormous volume of data coming from many different network devices and pull out the relevant data to diagnose trends or problems.
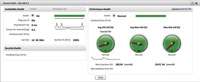
[Click on image for larger view.] |
| Figure 1. AccelOps All-in-One keeps a comprehensive eye on your infrastructure. |
AccelOps receives events, such as syslog, netflow or SNMP trap, and can pull data from systems using Simple Network Management Protocol (SNMP), TELNET, SSH, RPC [2] and other management protocols such as Windows Management Instrumentation, or in the case of VMware, published APIs along with an administrative account. You can also string together devices to monitor a complete end-to-end business application, including all the devices and services in the chain from end user, to router, to firewall, to switch, to server hardware, to hypervisor, to VMs, to applications. You can monitor application and network performance, availability, log events, security, patch levels and more from one dashboard. The system can also provide historical data for trend analysis and parse logs to identify relevant data. With more than 700 reports and 300 predefined application rules, the flexibility for alerts, reports, searches and audits is exceptional.
Installing AccelOps is a simple matter: It's available in two flavors, either as a virtual appliance [3] that can be installed on VMware 3.5 or 4.0, or as a Software as a Service (SaaS) offering. The virtual appliance [4] requires a minimum of four 64-bit cores and 8GB RAM, as well as an 80GB partition for the software and at least 1.5TB for data storage, which provides a year's worth of collection at 750 events/sec. At the high end, a system that monitors 10,000 events/sec requires two ESXi Quad Core 3GHz 64-bit CPUs, 16GB RAM and 17TB of storage.
Once you ensure the installation requirements have been met, the installer runs for a half hour or so to populate the database, and then the product is ready to use. For our test, the VM was installed on VMware ESXi 3.5, running on an HP ML370G5 with 32GB RAM.
Adding systems to be monitored is straightforward, requiring the IP address and the credentials to pull data out. Even systems not specifically supported can be monitored through SNMP traps, and the systems may be able to parse much of the data using standard management information bases. The homepage of the Web interface will guide you through the process of discovering your infrastructure, setting up monitoring and alerts, and creating the business services that can monitor and analyze end-to-end performance of complete applications. The homepage also describes how to search real-time or historical data to identify trends or find specific info, and how to set up dashboards for specific purposes.
Intelligent Search
This package is easy to use, with predefined rules and reports that will satisfy most organizations without the need for customization -- although that's possible as well. While the overall system is necessarily complex with the huge variety of systems, devices and software that can be monitored, it's relatively simple to find the nodes you want, set up chains of related systems for an entire business process, and set up rules for alerts, reports or analytics.
The five tabs -- Dashboards, Analytics, Incidents (alerts), Configuration Management Database (CMDB) and Administration -- have a clearly laid out set of options under each. A wide variety of features and options are well-organized, with context-sensitive drop-down menus and help available throughout.
Each tab offers a clean interface that makes it easy to drill down to the information you need or get an overall picture of an entire server or business process. Getting a picture of an individual hardware system is simple.
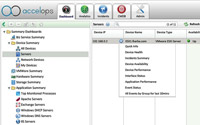
[Click on image for larger view.] |
| Figure 2. The AccelOps All-in-One package tracks a large number of devices and servers. |
Likewise, drilling down to specifics on a server is also a quick process -- drop-down, context-sensitive menus provide a wealth of options.
Specific VMware functionality offers great tools for easy visibility into all of your VMware servers, with an easy-to-read view of the most pertinent details for each server and VM, along with the ability to quickly and easily drill down to specifics as needed.
In addition to finding and monitoring VMware servers and VMs, AccelOps All-in-One can intelligently search through logs to identify the information necessary to track down problems. For instance, it can use log-in information as well as IP addresses to discover which users are actually accessing VMs, regardless of which workstation they're logging in from, or whether accounts are being shared by multiple users.
The package can not only send alerts if thresholds are exceeded; it can also monitor systems for any sort of changes, and alert the administrator if systems are changed without authorization. Additionally, it can monitor compliance with required patch levels or software versions. This includes both VMware host OSes and software running on the hosts. It can consolidate logs from many different systems into a single searchable database, allowing for the isolation of problems across the entire network. Security Information and Event Management 2.0 features enable a standardized approach to collecting and analyzing the data from all the different logs.
AccelOps All-in-One is not for everyone. Most organizations won't buy it just to monitor VMware servers -- the real benefit comes from being able to monitor all the hardware and software involved in delivering a particular business service, not simply monitoring VMs. Also, at a starting price of $24,000 for a virtual appliance or $2,000 per month for the Software as a Service version, the cost may be prohibitive for smaller companies. However, with its ability to greatly facilitate finding and diagnosing network problems -- along with its abilities to monitor trends over extended periods of time in order to isolate potential problems and generate alarms when any part of an extended infrastructure begins to fail -- the product can save a lot of time and allow fewer people to manage more systems.
[Editor's note: The oline version of this review differs from the print version due to technical errors of fact pointed out by the vendor; corrections are indicated above by bracketed numbers.]
About the Author
Logan Harbaugh is a freelance reviewer and IT consultant located in Redding, Calif. He has been working in IT for almost 20 years and has written two books on networking, as well as articles for many computer publications.