In-Depth
Hands-On with UL Procyon AI Benchmarking Tool from Maker of PCMark
In a previous article I looked at UL Solutions' newest test suite, Procyon. Procyon is the successor to its widely successful benchmarking tool, PCMark. Procyon was designed to benchmark today's modern workloads, including office, photo and video applications, but Procyon takes it to the next level by benchmarking the most exciting topic in IT today: AI.
In the previous article, I looked at and ran the Procyon Office Productivity benchmark on my laptop; in this article, I will look at running the company's AI and ML benchmarking tool, called UL Procyon AI Inference Benchmark for Windows. Available with a $5,000 site license, the company's benchmark suite is not inexpensive, but considering what it does, it should be in the toolbox of corporations that genuinely care about how well their hardware performs AI tasks.
 [Click on image for larger view.]
About UL Procyon AI Inference Benchmark for Windows
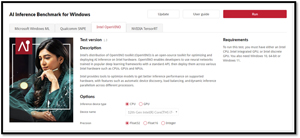
Tests conducted with this benchmark are designed to examine AI systems, which are rapidly evolving and becoming an integral part of our daily lives, thus making it crucial to evaluate and validate their performance in various hardware/software scenarios. The AI benchmark address this by providing a comprehensive framework for assessing AI systems' functionality, accuracy and robustness. It does this by using various AI models and testing protocols. These tests can help developers, policymakers and end-users make informed decisions about the hardware they use for deploying their AI technologies.
One of the critical strengths of the benchmark lies in its adaptability to different AI applications and use cases. Some use cases it targets are autonomous vehicles, medical diagnostics and natural language processing (NLP). Using these tests offers a standardized methodology to assess the performance of AI algorithms under various conditions. Furthermore, the tests consider the dynamic nature of AI systems, allowing for continuous evaluation and improvement over time.
The benchmarking software utilizes software development kits (SDKs) to measure AI inference performance, including Microsoft Windows ML, Qualcomm SNPE, Intel OpenVINO and NVIDIA TensorRT. Both float- and integer-optimized versions of each model are included in the benchmark.
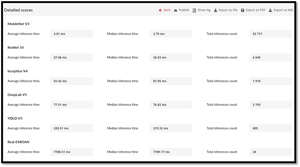
The tool employs various neural network models tailored for specific tasks. MobileNet V3 is optimized for mobile devices and efficiently identifies image subjects, while Inception V4 is used for image classification. YOLO V3 can detect objects' locations, while DeepLab V3 clusters pixels to segment images semantically. Real-ESRGAN enhances image resolution through synthetic data training, and ResNet 50 uses residual blocks for image classification results. Using these different models with a distinct purpose gives a broad overview of the hardware's capabilities for other tasks.
Requirements
The hardware requirements for the system that it runs on are surprisingly light.
| OS |
Windows 10, 64-bit, or Windows 11 |
| Processor |
2 GHz dual-core CPU |
| Memory |
4GB |
| Storage |
4GB |
Laptop AI Test
I first ran Procyon AI tests on a Dell Latitude 5430 laptop with a 12th Gen Intel Core i7-1255U and 16GB of RAM.
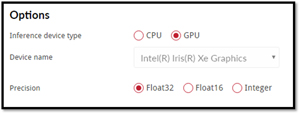
The Procyon dashboard only allows you to run tests compatible with your hardware. The two tests I could run were the Intel OpenVINO test and the Windows ML test. You can choose between running the tests using the CPU or GPU. I first ran the OpenVINO utilizing the CPU.
 [Click on image for larger view.]
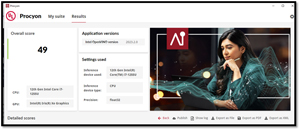
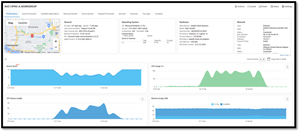
It took the test about 21 minutes to run. The results showed that the laptop had a score of 49. This gives you an overview of the systems.
 [Click on image for larger view.]
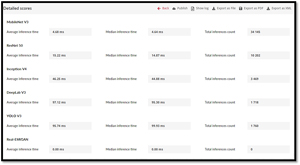
In the next section, it showed the detailed scores of the test that it ran.
 [Click on image for larger view.]
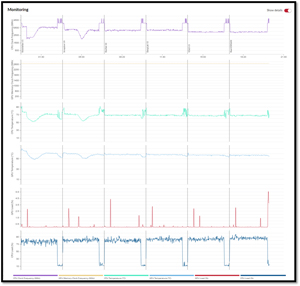
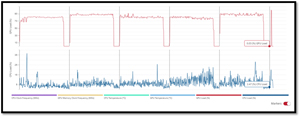
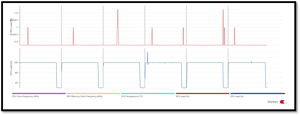
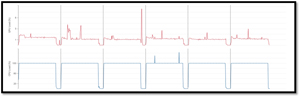
The scorecard's middle showed a graph showing the CPU and GPU clock frequency, temperature and load. The graph was shown over time and showed what application was running during that time. By clicking Show details you can see all the graphs. Pointing to a position on the graphs will show the value at that point.
 [Click on image for larger view.]
As expected, most of the work was done by the CPU, with just a few minor bumps of inconsequential nature shown for the GPU.
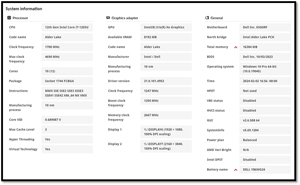
Information about the system was shown at the bottom of the scorecard.
 [Click on image for larger view.]
The results of the test can be exported in different forms.
I then reran the test using the GPU.
 [Click on image for larger view.]
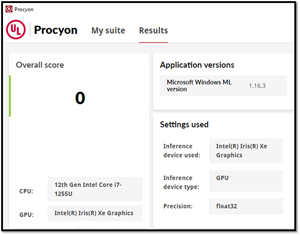
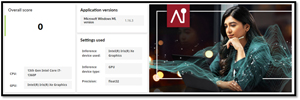
Like the CPU test, the GPU took about 20 minutes to run. The GPU test came back with an overall score of 0.
 [Click on image for larger view.]
It looks like the overall score was 0, as the Real ESRGAN test scored 0. The other five tests ran without any issues.
 [Click on image for larger view.]
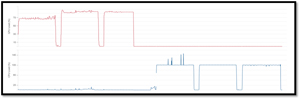
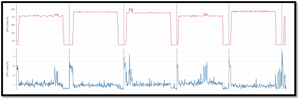
This time, the graph showed that most of the work was done by the GPU, with some activity for the CPU. This made sense to me as the CPU probably needed to do some of the system work and housekeeping chores while the GPU did the AI work.
 [Click on image for larger view.]
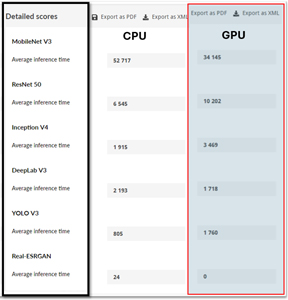
Looking at the detailed scores side-by-side shows that three of the tests ran better on the CPU, and three ran better on the GPU. This did not surprise me as the processor on the laptop had an integrated GPU rather than a discrete GPU.
 [Click on image for larger view.]
Benchmarking the Moonstone NUC
The next system that I benchmarked was a SimplyNUC Moonstone mini-PC. The Moonstone NUC, powered by AMD's 7000 processor family, offers three variants starting at $699, all of which use AMD Ryzen processors. I will use the CBM3rMS model with a Ryzen 9-7940HS, 32GB RAM and a 1TB NVMe.
The Ryzen processor powering this system was released in Q2 2023 and has eight cores and 16 threads, with a 3.1GHz base and a 4.3GHz boost clock speed. Its 70MB cache and PCIe 4.0 allow it to handle multitasking effortlessly. It scored a CPU Mark rating of 30905.
Moonstone systems support up to 96GB DDR5-5600 RAM and 8TB storage. This one comes with 2.5 NIC LAN, Wi-Fi 6E, Bluetooth 5.2 and extensive I/O options, including USB 4 Type-C, USB 3.2 Gen2, HDMI 2.1, DP 2.0 and MicroSD, all fitting into a compact 4-inch x 4-inch x 2-inch form factor.
Overall, this is a beast of a mini-PC, and you can read my full review of it here.
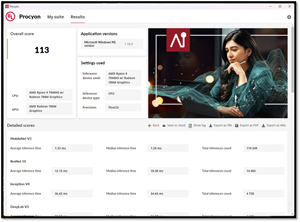
As the Moonstone uses an AMD processor, I did not have the option to use OpenVINO for the testing, so I used the Windows ML tests using the CPU.
 [Click on image for larger view.]
The overall score of Moonstone was 113.
 [Click on image for larger view.]
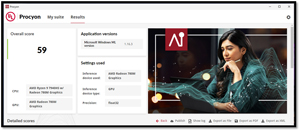
I then ran the same test using the GPU in the system. The GPU is an integrated Radeon 780M. It reported an overall score of 59.
 [Click on image for larger view.]
Interestingly, the detailed metrics showed that the GPU was only used for the first three tests, and then it reverted to the CPU for the remaining test.
 [Click on image for larger view.]
Benchmarking the Intel NUC 13
I have done a lot of work with NUC 13 Pro Desk Edition in the past and was interested to see how well this system, with its i7-1360P Processor, 16GB of RAM and 512GB Gen 4 NVMe SSD running Windows 11 Pro, would compare on the AI score.
This device has 12 total cores, four of which are performance (P) and eight are efficient (E). It has a total thread count of 16. The performance cores have a maximum turbo speed of 5GHz, while the efficient cores have a maximum turbo speed of 3.70GHz. It has a 1.5GHz Intel Iris Xe Graphics embedded GPU, which has 96 execution cores and supports up to four displays. It has a PassMark CPU benchmark score of 19206.
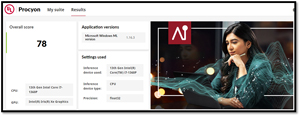
Both Intel and OpenVINO AI tests were available. I first used the Windows ML version on the CPU. The overall AI score was 78.
 [Click on image for larger view.]
As expected, heavy CPU usage was shown during the testing.
 [Click on image for larger view.]
To get a better idea, I looked at other metrics coming from Edge DX tool from ControlUp, where I work. I found that the CPU queue length reached 30 during the testing. This is information that is not available from the metrics supplied by Procyon.
 [Click on image for larger view.]
The score was zero when I ran the Windows ML version on the GPU.
 [Click on image for larger view.]
The details score showed that, like with my laptop, the ESRGAN tests did not run.
 [Click on image for larger view.]
The detailed metrics showed that the GPU was heavily utilized during the five tests that did run.
 [Click on image for larger view.]
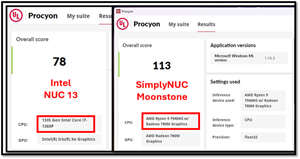
Conclusion
I think what brought home to me the value of the Procyon AI testing suite is when I compared two top-tier mini-PCs, the Intel NUC 13 and the SimplyNUC Moonshot. These systems are similarly priced, but the Moonstone blew the NUC 13 system away with a score of 113 to 78! This is a 45 percent improvement in scores.
 [Click on image for larger view.]
I must caution you that I am just beginning to work with the Procyon AI testing suite, so these numbers and my testing methodology may be flawed. I encourage you to run your own tests before deciding which hardware platform to use for your AI projects.
Although these tests were run on desktop systems and not servers where much AI processing is done, desktop and smaller systems are also used for AI development and edge computing.
At $5,000 per year, this is not an inexpensive benchmarking suite, but considering the resources that AI applications use for corporations that use AI extensively, it is a relative bargain. I look forward to doing more testing using the suite.