How-To
Setting Up and Working with Amazon WorkSpaces, Part 4
After previously detailing how to set up WorkSpaces using Simple AD for Active Directory, services, Tom Fenton looks at some available tools to monitor WorkSpaces.
This is the fourth article in my series on WorkSpaces, Amazon's Desktop-as-a-Service (DaaS) solution. In my previous articles (located here, here and here), I wrote about setting up WorkSpaces using Simple AD for Active Directory (AD) services.
In this article, I will look at some available tools to monitor WorkSpaces. First, I will look at CloudWatch, the native Amazon Web Services (AWS) tool, and then I'll explain how I deployed ControlUp, a third-party tool.
CloudWatch
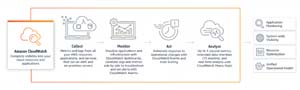
The Amazon WorkSpaces Administration Guide states that you can use CloudWatch Metrics, CloudWatch Events and CloudTrail logs to monitor WorkSpaces.
 [Click on image for larger view.]
CloudWatch Metrics allows you to monitor your WorkSpaces in one of three ways: by using the CloudWatch console, the command line interface, or the CloudWatch API to program. You can also set alarms when you reach a specified threshold for a certain metric. There are currently 11 metrics that CloudWatch Metrics can gather, dealing with factors that are external to WorkSpaces, ranging from the number of WorkSpaces that have a user connected to them, to the round-trip time between the WorkSpaces client and a WorkSpace.
The Amazon CloudWatch Events feature is used to view, search, download, archive, analyze and respond to successful logins to your WorkSpaces. This tool is useful if you need to know what type of clients are being used to access a WorkSpace, or when a user logged in to their WorkSpace.
AWS CloudTrail provides a record of actions taken by a user, role, or AWS service in WorkSpaces. With CloudTrail, you can determine the IP address from which the request to connect to a WorkSpace was made, as well as who made the request, and when.
Because using the command line and API to examine metrics, although useful, is beyond the scope of this article, I will be using the AWS Management Console to examine these metrics instead.
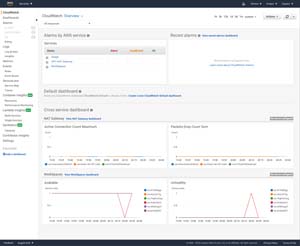
The default dashboard for CloudWatch gives a very high-level overview of your environment.
 [Click on image for larger view.]
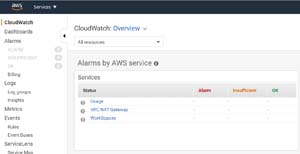
You can drill down deeper into your WorkSpaces by opening the Services widget and clicking WorkSpaces.
 [Click on image for larger view.]
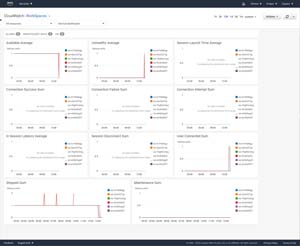
This overview screen displays the 11 metrics that CloudWatch metrics gathers, which deal with connecting to the WorkSpaces but are not performance-related.
 [Click on image for larger view.]
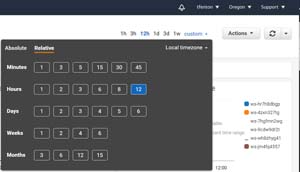
By clicking the custom time range, it shows that these metrics are retained for 15 months.
 [Click on image for larger view.]
The high-level overview CloudWatch provides of what is happening to a WorkSpace is external to the Workspace -- it does not report what is happening inside the WorkSpace. To examine this, you can use the tools that come with Windows, such as Perfmon, Task Manager and Services. All these tools work as expected, but they only show the information for a single WorkSpace. To view multiple WorkSpaces, you will need to use a different tool; in my case, I chose to use ControlUp.
ControlUp is a monitoring, troubleshooting and remediation tool that is very frequently used in Citrix and VMware Horizon environments. For more general information about ControlUp, you can find the previous articles that I wrote about it here, here and here.
Installing ControlUp
Because the machines that ControlUp monitors and manages must be part of an AD domain, I verified that the machine I download ControlUp to was part of a domain by entering whoami /ALL in the command prompt window.
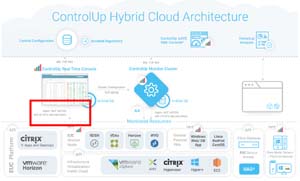
The ControlUp architecture showed that the ControlUp agent installed on the desktops being monitored was using TCP port 40705 to communicate to the ControlUp Console.
 [Click on image for larger view.]
I opened the port on the WorkSpaces that I would be monitoring by running the following command:
netsh advfirewall firewall add rule name="ControlUp Agent" dir=in action=allow protocol=TCP localport=40705
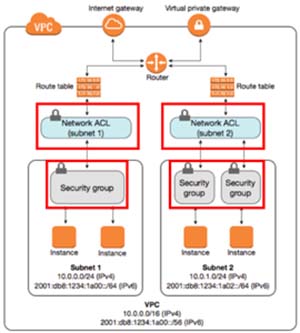
Inside Amazon Virtual Private Clouds (VPCs), there are two additional firewalls layers: security groups and network access control list (NACL).
 [Click on image for larger view.]
Security Groups provide network security between WorkSpaces in a subnet, and NACL provides network security between subnets.
By default, AWS has very strict Workspace-to-Workspace firewall rules for the security groups. I created a new rule for the security group and NACL to allow communications via port 40705 from the ControlUp agent to the ControlUp console. You can read how to do this here and here.
I downloaded the free ControlUp trial to one of my WorkSpace instances, which was a 120MB zip file. To install ControlUp, I extracted it, then pressed shift and right-clicked the ControlUpConsole.exe file and selected Run as administrator. When it first came up, I was asked for my name and work email address, and was then presented with a wizard to create an organization.
A ControlUp organization represents groups of objects (e.g., hosts, VMs, servers) managed by the same administrators. Although you can create additional organizations to segment your computers into different administrative units managed by different administrators, I just created a single organization.
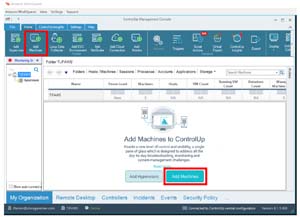
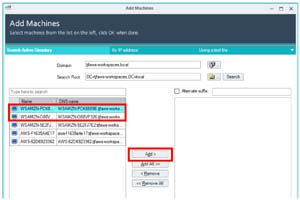
I then clicked Add Machines.
 [Click on image for larger view.]
The console found my WorkSpace along with two other machines, which I suspect were the Linux SAMBA 4 servers. I selected the two WorkSpaces and selected Add.
 [Click on image for larger view.]
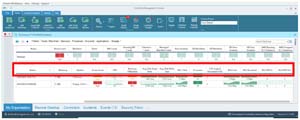
The agent was installed on the machines automatically, and I was able monitor the machines from an internal, rather than an external, view.
 [Click on image for larger view.]
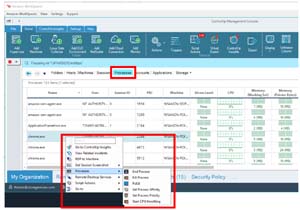
I could see and manage the process, including ending, killing and setting process affinity, priority and CPU throttling.
 [Click on image for larger view.]
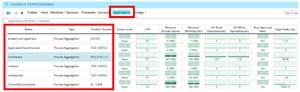
I could also display the attributes for the applications that were running on the WorkSpaces.
 [Click on image for larger view.]
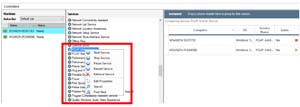
I could even manage the services running on the WorkSpaces.
 [Click on image for larger view.]
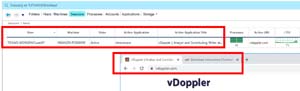
By clicking on the Sessions tab, I could review a number of factors, such as which user was logged onto the machine, the active application, logon time, how many processes are running on it and the active URL that was being accessed.
 [Click on image for larger view.]
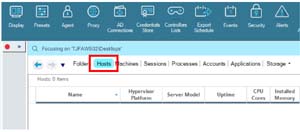
As ControlUp does not have visibility to the AWS hypervisor, I did not see any values listed when I clicked on the Hosts tab.
 [Click on image for larger view.]
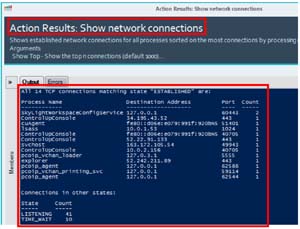
I was able to run script actions against the desktops without any issues. The output of the show network connections script is shown below.
 [Click on image for larger view.]
Conclusion
Although CloudWatch does provide a basic overview of WorkSpaces, it is limited in a couple ways. It only shows 11 metrics, and only examines WorkSpaces. It does not provide a deep introspection into the Windows OS that is needed to monitor, troubleshoot and remediate issues that WorkSpaces users may experience.
(Note: Tom Fenton is a technical marketing manager at ControlUp.)