News
OpenTelemetry Pushes Deeper into Cloud Observability
OpenTelemetry, the open source observability framework for collecting traces, metrics and logs, has graduated at the Cloud Native Computing Foundation, marking a new maturity milestone for a project that is increasingly used across distributed application and infrastructure monitoring.
"As organizations increasingly scale AI and cloud native workloads, real time observability is critical for operational success," said Chris Aniszczyk, CTO, CNCF. "OpenTelemetry's graduation solidifies it as the essential, unified observability standard, providing the consistent visibility required to understand and oversee complex systems. Since the project's inception, it has been incredible to witness the sheer growth and adoption OpenTelemetry has had in the cloud native community and beyond. The project creators, maintainers and community members should all be proud of this milestone."
Also known as OTel, OpenTelemetry provides vendor-neutral APIs, SDKs, instrumentation and collection tools for generating and exporting telemetry data. Its role is not to replace observability backends, but to give organizations a standard way to move operational data from applications and infrastructure into platforms such as Azure Monitor, Amazon CloudWatch and Google Cloud Observability.
Recent official documentation and announcements show that cloud providers are building OpenTelemetry Protocol support into managed services and operations tooling. Microsoft documents OTLP ingestion for Azure Monitor across Azure Kubernetes Service, virtual machines, Virtual Machine Scale Sets and Azure Arc-enabled servers; AWS has added OpenTelemetry metrics support for CloudWatch and Amazon EKS Container Insights; and Google Cloud documents OTLP support for Cloud Trace, Cloud Monitoring and Google Cloud Observability.
Observability data increasingly comes from distributed systems that cross application frameworks, containers, managed services, Kubernetes clusters, virtual machines and cloud boundaries. OpenTelemetry provides a common way to generate and move that telemetry, while cloud providers and observability vendors provide storage, dashboards, alerting, query tools and analysis experiences.
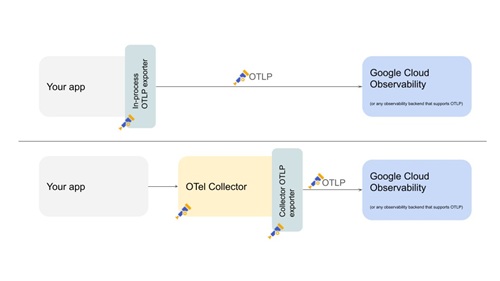 [Click on image for larger view.] OpenTelemetry Cloud Data Paths (source: Google Cloud).
CNCF Graduation Sets the Context
The Cloud Native Computing Foundation on May 21 listed OpenTelemetry as a graduated project, after its acceptance into CNCF in 2019 and incubation in 2021. The CNCF project page describes OpenTelemetry as a project that provides a collection of tools, APIs and SDKs for creating and managing telemetry data. CNCF's May 2026 graduation announcement described the project as a vendor-neutral, open source observability framework designed to standardize the collection, processing and exporting of metrics, logs and traces.
CNCF also positioned OpenTelemetry as part of the broader cloud native ecosystem. The project is not only an application performance monitoring technology; it also touches the telemetry pipelines used to understand distributed workloads, infrastructure services and platform operations.
The OpenTelemetry documentation says the project is not an observability backend. Instead, it is a framework and toolkit for generating, exporting and collecting telemetry data. That separation is important because the same telemetry approach can be used with different backends, including cloud-native services and commercial observability platforms.
Azure Monitor Adds OTLP Ingestion Paths
Microsoft's Azure Monitor documentation provides one example of how OpenTelemetry is being built into provider-native monitoring. The OpenTelemetry ingestion options documentation says OpenTelemetry Protocol is an open standard for transmitting traces, metrics and logs from applications and infrastructure to observability backends. It also says Azure Monitor supports OTLP ingestion so users can collect telemetry from workloads without proprietary instrumentation.
Microsoft documents different ingestion approaches for different compute environments, including Azure Kubernetes Service, virtual machines, Azure Arc-enabled servers and hybrid clouds. A related Azure Monitor OTLP ingestion article lists three mechanisms: OpenTelemetry Collector, Azure Monitor Agent and an AKS add-on.
The OpenTelemetry Collector path lets users send data directly to Azure Monitor cloud ingestion endpoints from an OTel Collector deployment. The Azure Monitor Agent path applies to applications running on Azure virtual machines, Virtual Machine Scale Sets or Azure Arc-enabled servers. The AKS add-on path collects telemetry from containerized applications running in AKS clusters.
That scope connects OpenTelemetry to Kubernetes, virtual machines and hybrid server estates. Microsoft also has separate documentation for using Azure Monitor Agent to ingest OTLP data from VMs, scale sets and Arc-enabled servers, and for collecting and customizing OpenTelemetry metrics from Azure virtual machines.
Kubernetes Becomes a Central Use Case
Kubernetes is one of the main infrastructure use cases for OpenTelemetry. The OpenTelemetry project provides Kubernetes-specific guidance covering the Collector, Operator and Helm charts. Its Helm chart documentation says users can manage installations of the OpenTelemetry Collector, OpenTelemetry Operator and OpenTelemetry Demo through OpenTelemetry Helm Charts.
The project documentation for installing the Collector with Kubernetes says the OpenTelemetry Operator can provision and maintain a Collector instance. It also lists Operator features including automatic upgrade handling, service configuration based on OpenTelemetry configuration and automatic sidecar injection into deployments.
The Kubernetes Collector component documentation says the OpenTelemetry Collector supports receivers and processors that facilitate Kubernetes monitoring. One documented component, the Kubernetes Attributes Processor, adds Kubernetes metadata to incoming application telemetry. The Collector chart documentation also describes presets for cluster metrics, Kubernetes events and host metrics, including collection of node, pod and container metrics from the API server on a kubelet.
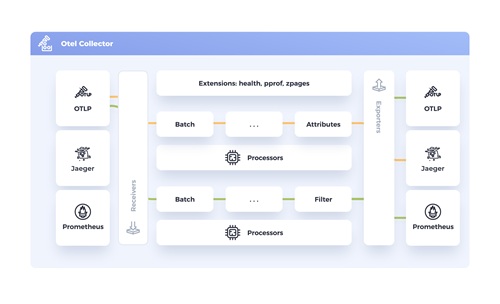 [Click on image for larger view.] Otel Collector (source: OpenTelemetry.io).
That Kubernetes focus is also reflected in provider services. Microsoft documents AKS-based ingestion. AWS now has OpenTelemetry-based Container Insights support for Amazon EKS. Google Cloud documents Collector and OTLP paths that can be used with Google Cloud Observability.
AWS Brings OpenTelemetry Into CloudWatch
AWS has made OpenTelemetry a more visible part of Amazon CloudWatch. In an April 2026 announcement, AWS said CloudWatch supports native OpenTelemetry metrics in public preview, enabling users to send metrics directly with OTLP without custom conversion logic or additional tooling.
AWS CloudWatch documentation describes OpenTelemetry as an open source observability framework that provides vendor-agnostic instrumentation for collecting metrics, logs and traces from applications. The same documentation says CloudWatch supports OpenTelemetry natively across all three signal types, with metrics queryable with PromQL, logs searchable with Logs Insights and traces explorable with Transaction Search.
AWS also announced CloudWatch Container Insights with OpenTelemetry metrics for Amazon EKS in public preview. AWS said the capability collects more metrics from open source and AWS collectors and sends them to CloudWatch using OTLP. AWS documentation says Container Insights with OpenTelemetry metrics provides visibility into the operational health of Amazon EKS cluster infrastructure.
That brings OpenTelemetry into the monitoring flow for EKS environments. It also links OpenTelemetry data with CloudWatch and Amazon Managed Grafana use cases, including PromQL queries over metrics in CloudWatch.
Google Cloud Expands OTLP Support
Google Cloud has also added OTLP support across its observability stack. In September 2025, Google Cloud announced that Cloud Trace, part of Google Cloud Observability, supports users sending trace data using OTLP through telemetry.googleapis.com. The announcement described OTLP as a data exchange protocol designed to transport telemetry from a source to a destination in a vendor-agnostic fashion.
Google Cloud later announced OTLP support for Cloud Monitoring metrics. The company said users can create OTLP metrics using the OpenTelemetry SDK, collect and transform them using the OpenTelemetry Collector, and send the data directly to Cloud Monitoring in OpenTelemetry format.
Google Cloud documentation for the Ops Agent OTLP receiver says users can collect OTLP metrics from applications and send those metrics to Cloud Monitoring, and collect OTLP spans and send them to Cloud Trace. The documentation also says the receiver can collect traces from third-party applications with built-in OTLP support or plugins with that support.
Google also documents a Google-built OpenTelemetry Collector for collecting OTLP traces, metrics and logs and exporting the data to Google Cloud Observability and other backends. Separate documentation shows how to deploy that Google-built Collector on Cloud Run to collect OTLP logs, metrics and traces from instrumented applications and export the data to Google Cloud.
Serverless and AI Agent Workloads Extend the Pattern
OpenTelemetry is also appearing in serverless and AI-related monitoring guidance. Microsoft documentation for Azure Functions says OpenTelemetry support enables distributed tracing across multiple function calls by using integrated Application Insights and OpenTelemetry support. A related Azure Functions how-to says function apps can be configured to export log and trace data in an OpenTelemetry format.
Google Cloud documentation for the Agent Development Kit says ADK framework versions 1.17.0 and later include built-in support for OpenTelemetry and sending OpenTelemetry telemetry data to Google Cloud Observability. Visual Studio Code 1.121 release notes also connect OpenTelemetry signals with cloud observability by describing a prebuilt Azure Managed Grafana dashboard for OpenTelemetry signals emitted by agents in VS Code.
Those examples show how observability requirements are expanding beyond VM and container metrics. Modern applications increasingly include serverless functions, managed AI services, coding agents, distributed APIs and third-party services. OpenTelemetry's documented role is to provide a common telemetry format and pipeline across those environments.
Provider Support Broadens
The current pattern in official documentation is that Azure Monitor, Amazon CloudWatch and Google Cloud Observability are all adding or documenting OTLP and OpenTelemetry support. Each provider continues to offer its own monitoring, logging, tracing, dashboarding and query tools, but the telemetry path into those tools is becoming more standardized.
OpenTelemetry can sit between workloads and observability backends as an instrumentation and collection layer. In Kubernetes, that may mean the Collector, Operator or Helm charts. In Azure hybrid scenarios, that may involve Azure Monitor Agent and Arc-enabled servers. In AWS EKS environments, that may involve CloudWatch Container Insights with OpenTelemetry metrics. In Google Cloud, that may involve the Ops Agent OTLP receiver or a Google-built OpenTelemetry Collector.
The significance is not that OpenTelemetry eliminates provider-specific monitoring tools. The documented trend is that provider-specific monitoring tools are adding OpenTelemetry and OTLP support. That gives enterprises a more consistent way to emit traces, metrics and logs from distributed workloads while still using services such as Azure Monitor, CloudWatch and Google Cloud Observability.
OpenTelemetry's adoption now spans managed Kubernetes, virtual machines, hybrid servers, serverless functions, AI agent observability and provider-native monitoring services. That makes it relevant to developers, cloud architects, platform engineering teams and infrastructure operations groups responsible for monitoring modern distributed systems.